|
Recreational Fishery
Stock Assessment
1999 Final Report
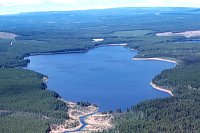
PHOTO 1. Grizzly Lake West
Aerial Photo, June 2001
Click image to view 72K JPG |
|
|
|
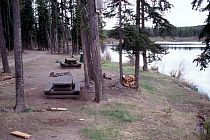
PHOTO 2. Grizzly Lake Forest Recreation Site
Click image to view 40K JPG |
|
|
| |
TABLE 1. Physical Attributes of
Grizzly Lake (West).
| Waterbody identifier |
01078LCHL |
| Water surface area |
137.1 ha. |
| Area above 6 m contour |
137.1 ha. |
| Shoreline perimeter |
6,130 m |
| Maximum depth |
6.5 m |
| Volume |
4,050,000 m3 |
| Mean depth |
3.0 m |
| Elevation |
982 m |
| T.D.S. |
88 mg/L |
| Morphoedaphic index |
29 |
|
|
This report presents the results of a stock assessment
of Grizzly Lake (West), completed on July 20, 1999,
under a partnership arrangement between the Ministry of
Environment, Lands and Parks and the Carrier
Sekani Tribal Council (CSTC), with funding obtained
from Fisheries
Renewal B.C. through the Upper Fraser and Nechako
Fisheries Council.
Margo French and Lawrence Ward of the CSTC delivered the
fieldwork component of the assessment; the author conducted
the analysis and reporting of the field results. Inquiries
pertaining to this report should be directed to the author
at the email and address located at the bottom of this page.
Grizzly Lake (West) is located 65 km southwest of Prince
George and is accessed via the Bobtail Forest Service road.
A 10 vehicle-unit B.C.
Forest Recreation Site is located adjacent to the lake
on an abandoned mill site, which provides access to the
lake's shore for car-top boats. Click here
for specific road directions to Grizzly Lake (West), and
here to view photographs of the
lake.
FIGURE 1. Number and mean mass of trout stocked in Grizzly Lake
(West), 1976-1999. |
|
|
A complete reconnaissance survey of Grizzly Lake (West)
was first performed by D.M. Coombes in June
1984, eight years after the lake had been initially
stocked. However, four separate creel surveys had been
completed prior to the 1984 survey : a one-day angler check
was performed by the Conservation Officer Service in 1975
(Nivison), and a series of surveys were completed between 1979 and 1981
(Aitken 1980, Dixon 1983) as part of
the development of a regional fisheries management plan.
The 1975 check revealed that a significant number of rainbow
trout were being removed from the lake, a situation which
likely influenced the decision to initiate supplemental
stocking in 1976.
The number of fish released into Grizzly Lake (West) was
variable (Figure 1 and Appendix
2) until 1988, when the number was reduced and subsequently
maintained at 5,000 fish per year. The mean mass of released
yearlings was generally larger throughout the 1990s than
in previous years, a reflection of improvements in hatchery
technology and fish culture policy. However, no systematic
approach had been undertaken to evaluate the performance
of the Grizzly Lake fishery in recent years, and the revised
stocking strategy had not been tested. The lake was accordingly
targeted for assessment in 1999, the results of which are
presented here and compared against previously collected
data.

Methods
| |
FIGURE 2. Location of Grizzly Lake (West) gill
net set, July 19-20, 1999. Click image to view
detailed 69K map. |
|
A 91.4 m sinking monofilament gill net of experimental
mesh sizes was set in Grizzly Lake (West) at 1:10 PM on
July 19, 1999, according to the methods specified in the
1997 Resource Inventory Committee document Fish
Collection Methods and Standards. The net was deployed
in a SW-NE orientation from the north shore (Figure 1) and was retrieved on July 20 at 11:00 AM, for
a total soak time of 21.2 hours.
All trout collected were sampled for fork length (mm) and
weight (to 25 g). A subsample was assessed for sex, maturity,
and stomach contents, which were examined in the field.
Scales were collected for age structure analysis from a
subsample of the total number of fish captured. The age
analysis was performed by Darlene
Gillespie of TimeMark Consulting Ltd. (Nanaimo, B.C.).
Results and Discussion
| |
TABLE 2. Physical attributes of rainbow
trout sampled in Grizzly Lake (West),
July 20, 1999.
| Attribute |
Mean |
Range |
Std. Dev. |
| Length (mm) |
307 |
124-421 |
55 |
| Weight* (g) |
254 |
25-750 |
132 |
| Condition* |
0.72 |
0.21-1.01 |
0.14 |
|
| *Five trout <50 g not weighed |
|
|
CATCH SUMMARY
The net catch yielded 78 rainbow trout (RB) for
a catch per unit effort (CPUE) of 3.68 RB per net-hour,
and 159 lake chub. No other species were captured.
See Appendix 1 for rainbow trout sample attribute data.
Of the total catch, 55 rainbow trout were assessed for
sex, maturity, and age determination. Of this subsample,
34 (62%) were female, 13 (24%) were male, and 8 (14%) could
not be classified. Six trout (11%) were classified as immature,
48 (87%) were maturing, and one (2%) could not be determined.
Eighteen trout had fish remains in their stomachs, indicating
that a portion of the population had shifted to a piscivorous
diet.
WEIGHT-LENGTH and CONDITION
The weight of the sampled population increased according
to the equation W = 2 x 10⁻⁸ x L 4.05
(R2=0.58), where W = weight in grams and L =
fork length in millimeters. The functional regression value
b = 4.05 suggests that the population exhibited allometric
growth and that larger fish were more rotund.
Since b > 3, the mean condition (K) of
the entire population is not necessarily indicative of the
health of the population, since K increases with
length in this case. The mean condition of fish larger than
350 mm was 0.80, which is relatively low when compared to
similarly sized fish from other lakes in the region. Interestingly,
the mean condition of fish >350 mm sampled in 1984 was
higher (K=0.97, n=4) than those sampled in this survey;
whether this is an artefact of sample timing, sample size,
or due to differences in weighing precision between the
two studies, is unknown. If none of these factors are responsible
for the difference noted, then the data would suggest that
larger trout have become less robust in recent years.
LENGTH FREQUENCY DISTRIBUTION and GROWTH
| |
FIGURE 3.
Length frequency distribution of rainbow trout
sampled in Grizzly Lake (West), comparing 1984
and 1999 results. |
|
The fork length frequency distribution of trout sampled
in 1999 was right-shifted relative to the population sampled
in 1984 (Figure 3), suggesting that the 1999 population
consisted of larger individuals overall. This difference
may be partly attributable to sample timing, as the 1999
survey took place 6 ½ weeks later than the 1984 assessment.
The improvement in growth may also reflect a response to
lower stocking densities, however since the level of natural
recruitment in Grizzly West is unknown, this cannot be directly
assessed. Nevertheless, with fewer hathery fish to contribute
to interspecific competition, it is reasonable to expect
that Grizzly West trout have exhibited a moderately positive
growth response.
The level of angler interest in Grizzly West can be indirectly
inferred by comparing historical creel data with gill net
data from recent years (Figure 4). No fish > 350 mm were
captured by anglers in 1980, and a low percentage were captured
in 1975.
FIGURE 4. Relative
catch of rainbow trout by length class, comparing
creel (1975,1980) and gill net (1984,1999) results.
Numbers in brackets indicate sample size. |
|
|
This is in sharp contrast to the 1984 and 1999 gill net
surveys, where 7% and 18% of the catch was made up of this
size class, respectively. While an improvement in growth
rate might account for part of this difference, it is also
possible that the level of retention by anglers in the late
1970s and early 1980s was significant enough to prevent
fish from reaching the larger sizes that have been observed
more recently. If fishing pressure has been reduced in recent
years, then it would be expected that larger fish would
turn up in the sample. While the separation between growth
differences and angling pressure cannot be directly quantified,
it is likely that reduced fishing pressure is partly accountable
for the presence of larger fish in 1999.
The trout sampled in this study exhibited a typical asymptotic
growth pattern, as seen in Figure 5, consisting of individuals
between 1 and 9 years old. In general, trout from the Omineca
region do not live past 6 years of age in lakes that receive
moderate angling pressure.
| |
FIGURE 5. Age vs. fork length
of rainbow trout sampled in Grizzly Lake (West),
July 20, 1999. |
|
The fact that Grizzly West contains fish up to 9 years
old lends additional support to the argument that angler
exploitation has diminished in recent years, since these
older cohorts would have been harvested under heavier use.
The rainbow trout sampled in 1984 were not aged, therefore
a direct comparison of the age class composition between
the two sample events cannot be made. At present growth
levels, Grizzly West trout enter into the recreational fishery
at Age 3, assuming a minimum catchable size of 250 mm. This
is on par with growth rates observed for trout in other
regional lakes, and is likely sufficient to sustain moderate
angling pressure.
Management Recommendations
Grizzly Lake (West) was stocked in order to create a high
yield fishery (note to file, 1989), and has been managed
accordingly since it was initially stocked in 1976. The
reduction in stocking from approximately 10,000 to 5,000
fish per year in 1988 appears to roughly coincide with a
reduction in angling pressure, resulting in a fishery which
today will provide recreational anglers with good quantities
of trout up to 750 g.
It would be worthwhile to resolve changes to trout growth
rates and angling pressure over time in order to better
understand the factors that drive fish production and yield
in Grizzly West. This could be accomplished by conducting
an age analysis of the scales collected in 1984, and by
repeating the coarse creel surveys that were completed in
the early 1980s. This would provide a useful statistic on
the recreational interest in a particular lake over time,
especially when one considers that the fishery performance
appears to be better today than it was 20 years ago. In
the meantime, continued stocking at present rates should
provide a sustainable and good quality fishery that meets
the "high yield" management objective for Grizzly
West.
Literature Cited.
Aitken, D. 1980. Creel Survey 1980 :
Prince George Area. Fisheries Branch. Ministry of Environment.
Prince George.
Dixon, B.M. 1983. A Review of Creel Data
for Region 7, Omineca. Fisheries Branch. Ministry of Environment.
Prince George.
Coombes, D.M.V. 1984. A Reconaissance
Survey of Grizzly Lake. Fisheries Branch. Ministry of Environment.
Prince George.
Nivison, C.J. 1975. Memorandum to G.
Chislett, Regional Fisheries Biologist. Prince George.
Appendix 1.
Appendix 2.
For More Information:
Contact :Ted
Zimmerman
Sr. Fisheries Biologist, Omineca sub-Region
Prince George, B.C.
250-565-6852 |