Recreational Fishery
Stock Assessment
1999 Final Report
|
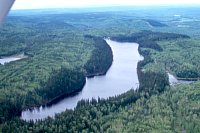
PHOTO 1. Trapping Lake
Aerial Photo. June 2001.
Click
image to view 55K JPG |
|
|
|
Introduction
| |
TABLE 1. Physical Attributes of Trapping
Lake
| Waterbody identifier |
00791TABR |
| Water surface area |
37.6 ha. |
| Area above 6 m contour |
20.2 ha. |
| Shoreline perimeter |
600 m |
| Maximum depth |
17.7 m |
| Volume |
2,249,871 m3 |
| Mean depth |
6.0 m |
| Secchi disk |
2.1 m |
| Elevation |
762 m |
|
|
This report presents the results of a stock assessment
of Trapping Lake, completed by Ted Zimmerman and Sean Barry
on June 4, 1998. Trapping Lake received assessments in 1961,
1968, and 1987 prior to it being stocked
in 1988 with rainbow trout. Since 1988, no population
surveys had been performed to determine the growth and abundance
of the stocked rainbow trout relative to the wild population.
In addition, forest road construction severely damaged Trapping
Creek in 1986, which eliminated the capability of the lake
to sustain its wild trout population. A follow-up survey
was therefore required to assess the status of the existing
fishery in Trapping Lake, and to document any changes to
the outlet habitat that had occurred over the last decade.
Trapping Lake was therefore assigned a high priority for
sampling as part of a region-wide stock assessment program
in 1998.

Methods
| |
 FIGURE 1. Location of Trapping Lake gill net set, FIGURE 1. Location of Trapping Lake gill net set,
June 1998.
Click image to view 45K GIF |
|
An experimental, 91.2m sinking monofilament gill net was
set in Trapping Lake on June 3,1998 according to the methods
outlined in the Resource Inventory Committee document Fish Collection Methods and
Standards. The net was deployed at 11:30 AM and retrieved
on June 4 at 11:05 AM, for a total soak time of 23 hours,
35 minutes.
The net was set from the west shore in an E-W direction,
originating just south of the lake's outlet (Figure
1). The net ranged in depth from the surface to approximately
7.5m.
All trout collected were sampled for fork
length and weight, and the sex and maturity of each
fish was recorded. (Appendix 1).
Scale
samples were collected from all rainbow trout, and were
sent to Darlene
Gillespie of TimeMark Consulting Ltd. (Nanaimo, B.C.)
for ageing. Upon return to the Ministry, scale prints were
subsequently checked and ages were adjusted by the author
to account for anomalies between the ages reported by the
contractor and the known stock
schedule and postulated age composition of rainbow trout
in Trapping Lake.
Data obtained during the 1998 assessment was compared with
data from the 1987 survey to determine the relative growth
and condition of wild vs. stocked fish.
Results and Discussion
| |
TABLE 2. Population characteristics of rainbow
trout sampled by gill net in Trapping Lake,
comparing 1987 and 1998 results.
| Year |
Sample
Size |
Length (mm) |
Weight (g) |
Condition |
| Mean |
Range |
SD |
Mean |
Range |
SD |
Mean |
Range |
SD |
| 1987 |
20 |
308 |
206-358 |
43 |
355 |
92-545 |
128 |
1.15 |
1.05-1.25 |
0.05 |
| 1998 |
58 |
298 |
109-418 |
69 |
190 |
10-720 |
184 |
1.12 |
0.66-1.38 |
0.13 |
|
|
CATCH SUMMARY
The net catch yielded 58 rainbow trout (RB), for
a catch per unit effort of 2.5 RB per net-hour. No other
species were captured. See Appendix
1 for individual rainbow trout sample data. Of the 58
rainbow trout captured, 41 (71%) were female, 11 (19%) were
male, and 6 (10%) could not be classified.
ANALYSIS
| |
 FIGURE 2. Length vs. weight of rainbow trout
captured in Trapping Lake, June 3, 1998
FIGURE 2. Length vs. weight of rainbow trout
captured in Trapping Lake, June 3, 1998
Click image to view 5K GIF |
|
Condition
The weight of Trapping Lake rainbow trout increased according
the equation W = 4x10⁻⁵ x L3.1655;
this relationship is expressed in Figure
2. Fish greater than 400 mm in length tended to be somewhat
lighter for their length than their smaller counterparts.
Of these three fish, two exhibited stomach parasitism which
were unique to these fish only (see Appendix
1). This parasitism likely explains the reduced condition
and may be symptomatic of the larger Trapping Lake rainbow
trout in general, as other anglers that were encountered
during the survey indicated that they had observed parasitism
in their catch as well.
Length-Frequency Distributions
| |
 FIGURE 3. Length frequency distributions of
rainbow trout captured in Trapping Lake, comparing
1968, 1987 and 1998 results. Numbers denote median
lengths of available age classes.
FIGURE 3. Length frequency distributions of
rainbow trout captured in Trapping Lake, comparing
1968, 1987 and 1998 results. Numbers denote median
lengths of available age classes.
Click
image to view 10K GIF |
|
Sampling bias
Figure 3 illustrates the length-frequency
distributions of the 1968, 1987 and 1998 rainbow trout populations
sampled in Trapping Lake, and the median lengths of each
age class of the latter two sample events. The discrepancy
between the number of length classes observed in 1998, compared
to the 1987 and 1968 samples is likely attributable to the
short set times (1987=3.25 hr, 1968=not avail.), and small
sample sizes (1987 N=20, 1968 N=17) of the first two surveys.
Aside from the difference in sample intensity, the absence
of smaller size classes in the first two surveys may be
due to the fact that wild yearlings remained in their natal
streams until such time as they were large enough to compete
effectively in a lake environment. If the yearlings sampled
in 1998 are of hatchery origin, their occurrence in the
main body of the lake may be attributable to an inability
to seek out suitable rearing sites. Another explanation
is that the 1998 yearlings had yet to adjust to the lake
environment and seek cover, after having been released only
5 days prior to the survey date. A third possibility may
be that, given the destruction of the lake's rearing habitat
(see above),these yearlings were left exposed in the main
body of the lake, with no suitable rearing habitat available
to them.
Recruitment
The presence of fish in the 190 - 220 mm size classes in
1998 suggests that the lake may support limited natural
recruitment, since these size ranges are too large to be
the yearlings stocked 5 days prior to the survey, but too
small to be 3-year-old fish. This argument is supported
by the fact that 2-year-olds were aged in the 1998 sample
(Figures 3 and 4, see below). Interestingly, 4-year-olds
were not sampled in 1998, and there appears to be a break
in the length-frequency distribution for this age class.
This result would be expected if the lake did not support
natural recruitment, since no cohorts of that year class
were stocked. This suggests that recruitment events occur
sporadically, perhaps during years with higher than normal
spring freshets, when high inlet flows would provide sufficient
habitat to support both spawning and rearing.
Growth
| |
TABLE 3. Mean lengths of Trapping Lake rainbow
trout, comparing 1987 and 1998 results (SE in
brackets)
| Year |
Mean Length
by Age (mm) |
|
| Age 1 |
Age 2 |
Age 3 |
Age 4 |
Age 5 |
| 1987 |
N/A |
244 (13.4) |
323 (5.0) |
340 (9.4) |
N/A |
| 1998 |
112 (2.5) |
222 (8.9) |
316 (5.4) |
N/A |
414 (2.2) |
|
|
While fish in age classes 2 and 3 exhibited slightly reduced
growth in 1998 relative to the 1987 sample (Table 2), the
change in growth is not so great as to affect the quality
of the fishery. Indeed, age 3 fish were on average only
7 mm smaller in 1998, and this difference was not significant
(t=0.65 p=0.52). If Trapping Lake rainbow trout were exhibiting
successful reproduction (i.e. contributing recruits to the
fishery), it would be expected that augmenting the age 1
cohort through stocking would result in slower growth due
to density dependent effects. The fact that this has not
occurred supports the argument that natural recruitment
is limited and does not contribute substantially to the
fishery.
Inlet/Outlet Observations
There has been no systematic investigation of the impacts
to spawning and rearing sites since 1986 (Photo
1), when the lake's outlet was severely damaged. A follow-up
survey took place in 1987 (Photo
2, and Photo 3), however
this was based on visual observations only. While on site
in 1998, we also conducted a cursory examination of the
inlet and outlet for spawning and rearing potential. The
outlet was blocked by a series of beaver dams, with little
flow downstream, while the inlet did not appear to provide
adequate flow. At that time, neither system was deemed suitable
for spawning or rearing, and our observations concur with
Westcott (1987) who rated the production
potential in Trapping Lake as low to negligible.
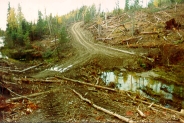
PHOTO 1.
Outlet of Trapping Lake, 1986
Click
photo to view 95K JPG
|
|
|
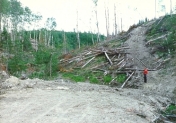
PHOTO 2.
Forestry road crossing outlet of Trapping
Lake, 1987
Click photo to view 95K
JPG |
|
|
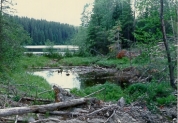
PHOTO 3.
Outlet of Trapping Lake, 1987
Click photo to view 101K JPG
|
|
Management Recommendations
The current structure of the Trapping Lake rainbow trout
population appears to be very similar to pre-stocked conditions,
as trout growth rates and size distributions have not shown
significant change over the last decade. While the CPUE
data might suggest that trout were more abundant in 1987
(1987=5.7 fish/hr, 1998=2.5 fish/hr), this data should be
viewed with caution as net catch rates can be influenced
by many extraneous factors which can vary in different years.
Assuming that fishing effort remains relatively constant,
the lake should continue to support a moderate recreational
fishery with catches of up to 700g (1.5 lbs). The potential
for the lake to produce larger fish is likely constrained
by its low productivity (TDS=37 ppm), and any attempts to
manipulate stocking rates in order to produce larger sized
fish would probably prove to be futile.
The current state of Trapping Creek continues to be a cause
for concern. The restoration of this creek to pre-impact
conditions would provide spawning and rearing habitat for
the current rainbow trout population. This work would ultimately
result in a self-sustaining fishery, and would thereby eliminate
the stock's reliance on hatchery production.
Literature Cited
Westcott, R. 1988. Note to file
regarding the 1988 stock assessment of Trapping Lake. Ministry
of Environment, Lands and Parks. Prince George.
For More Information:
Contact :Ted
Zimmerman
Sr. Fisheries Biologist, Omineca sub-Region
Prince George, B.C.
250-565-6852 |