
Status of Fine Particulate Matter in B.C. (2021-2023 & 2022-2024)
British Columbia has a network of air quality monitoring stations that measure fine particulate matter and other air contaminants. This indicator reports on the concentration of fine particulate matter from two reporting periods, 2021-2023 and 2022-2024. The data are reported as two metrics: an annual metric and a 24-hour metric, both based on three consecutive years of data. These metrics are compared against the Canadian Ambient Air Quality Standards to determine achievement and to define colour-based management levels. CAAQS were established by the Canadian Council of Ministers of the Environment in 2012 as a key element of the Air Quality Management System that collaboratively and comprehensively manages air quality in Canada. The maps and figures below primarily show results from the 2022-2024 period. Detailed findings for 2021-2023 can be found in the PDF version of the indicator available here (PDF 2MB)
- Fine particulate matter is a type of air contaminant. Fine particulate matter (PM2.5) refers to solid or liquid particles floating in air that are less than 2.5 microns in diameter, or less than 1/20th the width of a human hair. Major sources include wildfire smoke, residential woodburning, open burning, mining, vehicular emissions, and industrial operations (Air Pollutant Emissions Inventory Report 2026).
- Fine particulate matter can be harmful to humans. Exposure to fine particulate matter has been associated with severe public health impacts including heart and lung diseases (Health Canada). Both short-term and long-term exposures to fine particulate matter can have negative effects on human health even at low concentrations.
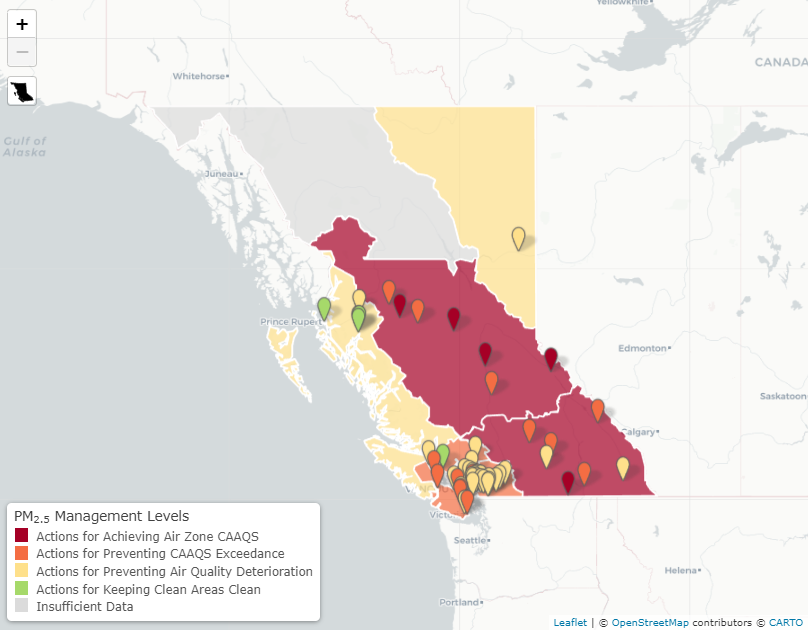
The map and charts below show the levels of PM2.5 at individual monitoring stations, and the assigned management levels for each of B.C.’s air zones. Each point shown on the map represents an air quality monitoring station with colours that describe the management level after removing the effects of wildfires and transboundary flows. The colour of each region is the management level assigned for the entire air zone, with values based on the station with the highest level of PM2.5. The results shown here are based on the 2022–2024 reporting period. The four management levels and the recommended actions are: (1) green (actions for keeping clean areas clean); (2) yellow (actions for preventing air quality deterioration); (3) orange (actions for preventing Canadian Ambient Air Quality Standard exceedance); and (4) red (actions for achieving air zone Canadian Ambient Air Quality Standard). Each management level corresponds to actions that become more rigorous as the level of fine particulate matter approaches CAAQS. Suggested actions for each management level are outlined in the Guidance Document on Air Zone Management. More information on management levels can be found below.
While the Guidance Document outlines the types of actions that may be taken at each management level, a range of actions are implemented across British Columbia to improve air quality. These actions may include provincial programs, regulatory measures, and community-level initiatives that address local sources of air pollution and vary by region. Examples of actions include programs to reduce emissions (such as wood smoke reduction initiatives), controls on open burning, and local or regional efforts to manage air quality. Summaries of actions and activities undertaken in B.C. can be found in Air Zone Management Response reports, which describe provincial and local efforts to improve air quality in different regions.
The map shows air quality stations with sufficient data to report for the 2022-2024 reporting period. When you click on a station, a graph appears showing both the original data and data that has been adjusted for Transboundary Flow and Exceptional Events (TF/EE). TF/EE adjustments occur when air pollutants travel from other geographic region to B.C. (TF) or when rare, natural, or human-induced events such as wildfire or volcanic eruptions impact air quality (EE). TF/EE adjustments remove the pollutants caused by these events because they are unpredictable and not part of typical/controllable emissions.
Tip: Click or tap on an air zone or monitoring station to see the status of fine particulate matter levels.
 Your screen is too small to display the interactive map. Click to see the interactive
visualization in full-screen.
Your screen is too small to display the interactive map. Click to see the interactive
visualization in full-screen.
- Tip: See Table 6.1 in the Guidance Document on Air Zone Management for more information about the suggested actions for each color/management level in the map below.
- 2021‑2023: fine particulate matter levels met the Canadian Ambient Air Quality Standards at 66 percent of assessed monitoring stations in B.C. There are two metrics for PM2.5: an annual metric and a 24-hour metric (see sidebar). The annual standard was met at 44 of the 56 stations (79%) for which valid data was obtained, while the 24-hour standard was met at 37 of the 56 stations (66%) with sufficient data for analysis.
- 2022‑2024: fine particulate matter levels met the Canadian Ambient Air Quality Standards at 70 percent of assessed monitoring stations in B.C. The annual standard was met at 47 of the 57 stations (82%) for which valid data was obtained, while the 24-hour standard was met at 40 of the 57 stations (70%) with sufficient data for analysis.
- During both periods, fine particulate matter levels achieved the annual Canadian Ambient Air Quality Standards in three of B.C.’s seven air zones, and met the 24‑hour standard in two air zones. The Coastal and Georgia Strait air zones met both the PM2.5 annual and 24-hour standards. The Central Interior air zone exceeded the PM2.5 24-hour standard at Houston, and the PM2.5 annual standard at Vanderhoof. The Southern Interior air zone exceeded the PM2.5 annual standard at Grand Forks in 2023 and Golden Helipad in 2024. There are currently no air quality monitoring stations in the Northwest air zone.


