
Status of Ground-Level Ozone in B.C. (2021-2023 & 2022-2024)
British Columbia has a network of air monitoring stations that measure ground-level ozone and other air contaminants. This indicator reports on the concentration of ground-level ozone from two reporting periods, 2021-2023 and 2022-2024. The data are reported as a metric based on three consecutive years of data. These metrics are compared against the Canadian Ambient Air Quality Standards to determine achievement and to define colour-based management levels. CAAQS were established by the Canadian Council of Ministers of the Environment in 2012 as a key element of the Air Quality Management System that collaboratively and comprehensively manages air quality in Canada. The maps and figures below primarily show results from the 2022-2024 period. Detailed findings from 2021-2023 can be found in the PDF version of the indicator available here (PDF 2MB)
- Ground-level ozone is a type of air contaminant. While ozone high up in the Earth’s atmosphere occurs naturally and helps protect us from the sun’s ultraviolet rays, ozone at ground level is a harmful pollutant. It forms when pollution from vehicles, industry, and other sources reacts in sunlight.
- Ground-level ozone can be harmful to humans. Exposure to ground-level ozone (hereafter ozone) can reduce lung function and cause inflammation of airways, which can increase respiratory symptoms and aggravate asthma (US EPA, 2013). These effects are linked to more emergency room visits, hospitalizations, and absenteeism, and higher health care costs (Willey et al., 2004).
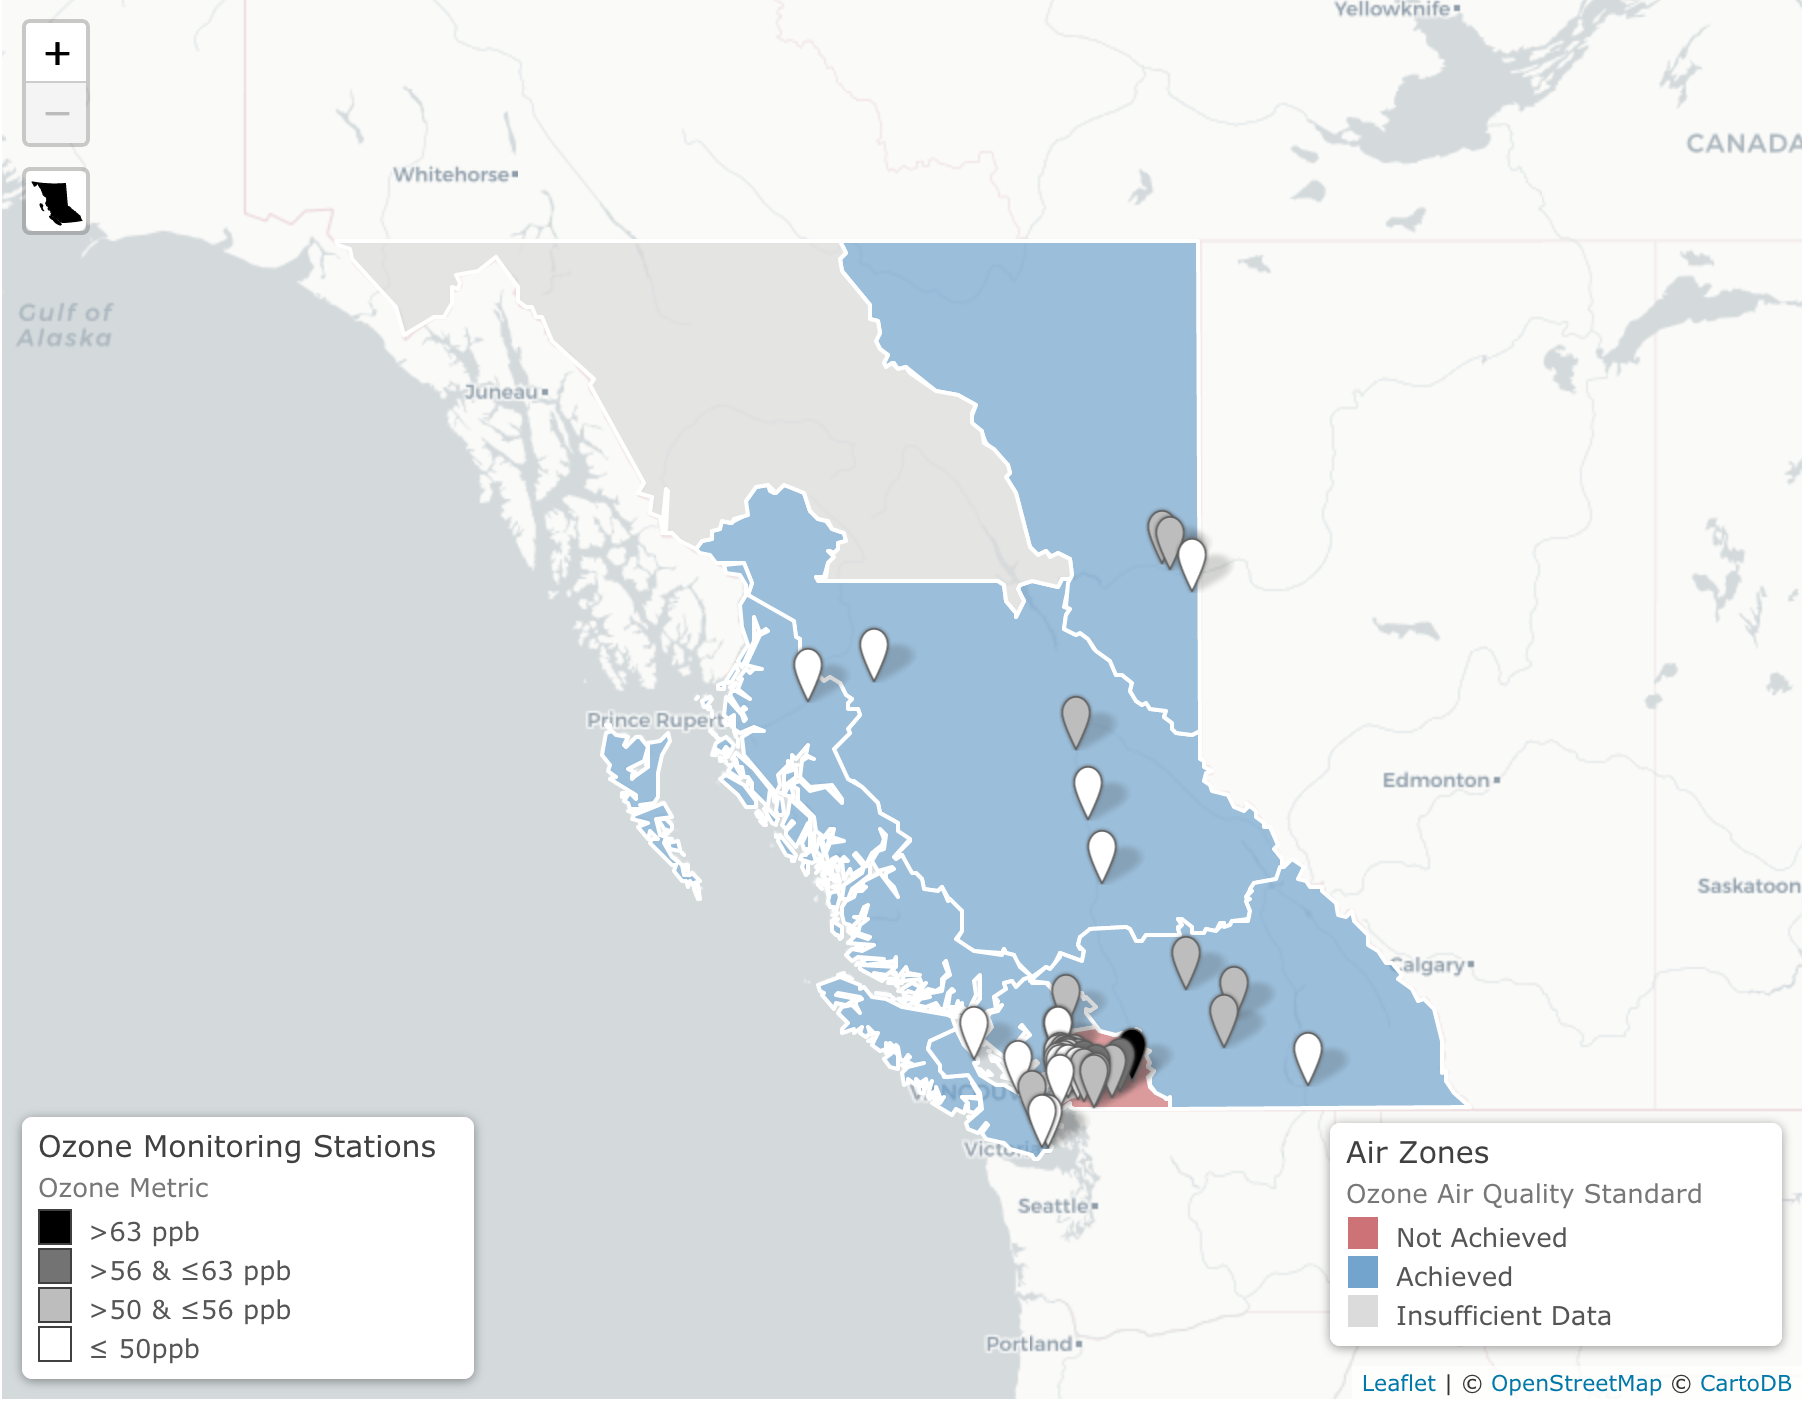
The map and charts below show the levels of ozone at individual monitoring stations, and the assigned management levels for each of B.C.’s air zones. Each point shown on the map represents an air quality monitoring station with colours that describe the management level after removing the effects of wildfires and transboundary flows. The colour of each region is the management level assigned for the entire air zone, with values based on the station with the highest level of ozone. The results shown here are based on the 2022–2024 reporting period. The four management levels and the recommended actions are: (1) green (actions for keeping clean areas clean); (2) yellow (actions for preventing air quality deterioration); (3) orange (actions for preventing Canadian Ambient Air Quality Standard exceedance); and (4) red (actions for achieving air zone Canadian Ambient Air Quality Standard). Each management level corresponds to actions that become more rigorous as the level of ozone approaches CAAQS. Suggested actions for each management level are outlined in the Guidance Document on Air Zone Management. More information on management levels can be found below.
While the Guidance Document outlines the types of actions that may be taken at each management level, a range of actions are implemented across British Columbia to improve air quality. These actions may include provincial programs, regulatory measures, and community-level initiatives that address local sources of air pollution and vary by region. Examples of actions include programs to reduce emissions (such as wood smoke reduction initiatives), controls on open burning, and local or regional efforts to manage air quality. Summaries of actions and activities undertaken in B.C. can be found in Air Zone Management Response reports, which describe provincial and local efforts to improve air quality in different regions.
The map shows air quality stations with sufficient data to report for the 2022-2024 reporting period. When you click on a station, a graph appears showing both the original data and data that has been adjusted for Transboundary Flow and Exceptional Events (TF/EE). TF/EE adjustments occur when air pollutants travel from other geographic regions to B.C. (TF) or when rare, natural, or human-induced events such as intrusion from upper atmospheric ozone, or wildfire impact air quality (EE). TF/EE adjustments remove the pollutants caused by these events because they are unpredictable and not part of typical/controllable emissions.
Tip: Click or tap on an air zone or monitoring station to see details on the status of ozone levels for the 2022-2024 reporting period.
Tip: See Table 6.1 in the Guidance Document on Air Zone Management for more information about the suggested actions for each color/management level in the map below.
 Your screen is too small to display the interactive map. Click to see the interactive
visualization in full-screen.
Your screen is too small to display the interactive map. Click to see the interactive
visualization in full-screen.
- 2021‑2023: Ozone levels met the Canadian Ambient Air Quality Standard at 44 of the 46 B.C. ozone monitoring stations. Ozone levels from the 46 stations ranged from 37 to 63 parts per billion (ppb). Ozone levels were ≤ 50 ppb at 25 reporting stations (54%). Two stations reported ozone levels > 62 ppb.
- 2022‑2024: Ozone levels met the Canadian Ambient Air Quality Standard at 46 of the 46 B.C. ozone monitoring stations. Ozone levels (see box below) from the 46 stations ranged from 38 to 62 parts per billion (ppb). Ozone levels were ≤ 50 ppb at 25 reporting stations (54%). There were no stations reporting ozone levels > 62 ppb.
- Ozone levels met the Canadian Ambient Air Quality Standard in five of B.C.’s seven air zones for 2021‑ 2023 reporting period and in six air zones for 2022‑2024. The ozone level for an air zone is the highest ozone level reported from monitoring stations within the air zone. Currently, there are no air monitoring stations in the Northwest Air Zone.
- Ozone levels are used to set management levels for each air zone. Four management levels (green, yellow, orange, and red) are each associated with a suite of actions that become more rigorous as ozone levels approach the Canadian Ambient Air Quality Standard.
More about the Canadian Ambient Air Quality Standard for Ozone:
- The statistical form of the Canadian Ambient Air Quality Standard ozone metric is the 3-year average of the annual 4th-highest daily maximum 8-hour rolling average concentration.
- The ozone metric for an air zone is the highest ozone metric reported from monitoring stations within the air zone.
- Criteria for data completeness and sufficiency of the ozone metric are described in the Guidance Document on Achievement Determination: Canadian Ambient Air Quality Standards for Ozone (2021).
- Air quality monitoring stations with at least two years of valid data from 2022-2024 were included in this indicator. Visit Current Air Quality Data for a complete list of currently active air quality monitoring stations across B.C.
Canada-wide Air Quality Management System
The Air Quality Management System is Canada's approach for protecting air quality. Under the Air Quality Management System, provinces and territories monitor, report and manage local air quality within air zones, with the goal of continuously improving air quality and keeping pollutants below the Canadian Ambient Air Quality Standards.
- There are seven air zones in British Columbia: Coastal, Georgia Strait, Lower Fraser Valley, Southern Interior, Central Interior, Northeast and Northwest.
- The Air Zone Management Framework defines management levels based on the highest ozone level reported from monitoring stations within the air zone.
- The four management levels are (1) green (actions for keeping clean areas clean); (2) yellow (actions for preventing air quality deterioration); (3) orange (actions for preventing Canadian Ambient Air Quality Standard exceedance); and (4) red (actions for achieving air zone Canadian Ambient Air Quality Standard). Actions for each management level are detailed in the Guidance Document on Air Zone Management (2019) (PDF). Air zone management levels are preferentially based on stations with 3 complete years of data.


More about the Air Quality Management System management levels:
- There are cases when an air zone does not achieve a given Canadian Ambient Air Quality Standard because of sources over which jurisdictions have little or no control over, such as those from transboundary flows and exceptional events, like wildfires.
- Before assigning management levels, jurisdictions have the option to adjust their air zone metric values by removing external influences. These arrangements aim to ensure that jurisdictions are responsible for managing only the emissions they can control.
- Wildfire influences were determined for 13 monitoring sites in B.C. on a total of 6 days for both 2021‑2023 and 2022‑2024 reporting periods. The daily concentrations for these days were removed from the calculations of management levels, but this resulted in no changes in management levels for ground-level ozone.
Methods
The methods used to develop this indicator—including procedures, data requirements, and calculation of the ozone metric—are detailed in the Guidance Document on Achievement Determination: Canadian Ambient Air Quality Standards for Fine Particulate Matter and Ozone (2012) published by the Canadian Council of Ministers of the Environment.
R package and code: We have developed an R package to facilitate the calculation of air quality metrics according to the Canadian Ambient Air Quality Standards. Download the 'rcaaqs' package from GitHub. The source code for repeating the analysis presented on this page is also available on GitHub.
References and Other Useful Links
- Access B.C.'s real-time data on air pollutants and find locations of all provincial air monitoring stations in B.C.
- Air Zone Management Response reports
- BC Lung Association's BC State of the Air Reports
- Canadian Ambient Air Quality Standards
- Canadian Council of Ministers of the Environment
- Canadian Environmental Sustainability Indicators: Air Indicators
- Guidance Document on Achievement Determination: Canadian Ambient Air Quality Standards for Ozone (2021)
- Guidance Document on Air Zone Management
- Learn more about the implementation of the Air Quality Management System in British Columbia
- Read individual Air Zone reports on the achievement of the Canadian Ambient Air Quality Standards in B.C.
- United States Environmental Protection Agency. 2013. Integrated Science Assessment of Ozone and Related Photochemical Oxidants (600/R-10/076F)
- Willey, J., N. Gilbert, and N. Lyrette. 2004. Human health effects of ozone: Update in support of the Canada-wide standards for particulate matter and ozone (Revised version). Working paper prepared for Canadian Council of Ministers of the Environment. Health Canada. Ottawa, Ontario.
Data
*By accessing these datasets, you agree to the licence associated with each file, as indicated in parentheses below.
- Indicator Summary Data: BC Ground-Level Ozone Canadian Ambient Air Quality Standards 2022-2024 (Licence: Open Government Licence - British Columbia)
- B.C. Ground-level Ozone Hourly Data & Air Monitoring Station Locations (Licence: Open Government Licence - British Columbia)
- B.C. Air Zones (Licence: Open Government Licence - British Columbia)
Download a printable version of this indicator (PDF)
Updated June 2026
Suggested Citation: Environmental Reporting BC. 2026. Status of Ground-Level Ozone in B.C. (2021-2023 & 2022-2024). State of Environment Reporting, Ministry of Environment and Parks, British Columbia, Canada.
