
Status of Nitrogen Dioxide in B.C. (2021-2023 & 2022-2024)
British Columbia has a network of air quality monitoring stations that measure nitrogen dioxide and other air contaminants. This indicator reports on the concentration of nitrogen dioxide from two reporting periods, 2021-2023 and 2022-2024. The data are reported as two metrics: an annual metric based on one year of data, and a 1-hour metric based on three consecutive years of data. These metrics are compared against the Canadian Ambient Air Quality Standards to determine achievement and to define colour-based management levels. CAAQS were established by the Canadian Council of Ministers of the Environment in 2012 as a key element of the Air Quality Management System that collaboratively and comprehensively manages air quality in Canada. The maps and figures below primarily show results from the 2022-2024 period. Detailed findings from the 2021-2023 analysis can be found in the PDF version of the indicator available here (PDF 2MB)
- Nitrogen Dioxide (NO2) is a gaseous pollutant. It forms along with other nitrogen oxides (NOx) when fossil fuels are burned in diesel trucks, cars, ships, power plants, and industrial facilities.
- NO2 can harm human health. Long-term exposure has been linked to allergic responses, asthma, greater susceptibility to respiratory infections (including COVID-19), and effects on the heart and reproductive system. Short-term exposure can reduce lung function and aggravate respiratory symptoms and airway inflammation. These effects have no known safe limits — they can occur even at low concentrations.
- Nitrogen dioxide and other nitrogen oxides can also harm the environment. They affect plant growth, contribute to acid rain, and play a role in forming ground-level ozone — all of which can damage ecosystems. NO₂ is also responsible for the reddish-brown haze sometimes seen over cities.
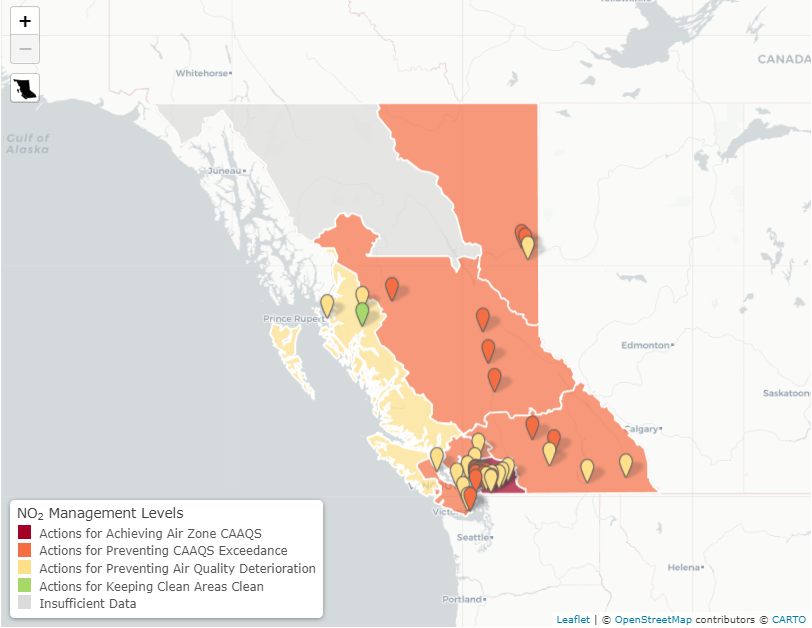
The map and charts below show the levels of NO2 at individual monitoring stations, and the assigned management levels for each of B.C.’s air zones. Each point shown on the map represents an air quality monitoring station with colours that describe the management level. The colour of each region is the management level assigned for the entire air zone, with values based on the station with the highest level of NO2. The results shown here are based on the 2022–2024 reporting period. The four management levels and the recommended actions are: (1) green (actions for keeping clean areas clean); (2) yellow (actions for preventing air quality deterioration); (3) orange (actions for preventing Canadian Ambient Air Quality Standard exceedance); and (4) red (actions for achieving air zone Canadian Ambient Air Quality Standard). Each management level corresponds to actions that become more rigorous as the level of NO2 approaches CAAQS. Suggested actions for each management level are outlined in the Guidance Document on Air Zone Management. More information on management levels can be found below.
While the Guidance Document outlines the types of actions that may be taken at each management level, a range of actions are implemented across British Columbia to improve air quality. These actions may include provincial programs, regulatory measures, and community-level initiatives that address local sources of air pollution and vary by region. Examples of actions include programs to reduce emissions (such as wood smoke reduction initiatives), controls on open burning, and local or regional efforts to manage air quality. Summaries of actions and activities undertaken in B.C. can be found in Air Zone Management Response reports, which describe provincial and local efforts to improve air quality in different regions.
Tip: Click or tap on an air zone or monitoring station to see details on the status of nitrogen dioxide levels for the 2022-2024 reporting period.
Tip: See Table 6.1 in the Guidance Document on Air Zone Management for more information about the suggested actions for each color/management level in the map below.
 Your screen is too small to display the interactive map. Click to see the interactive
visualization in full-screen.
Your screen is too small to display the interactive map. Click to see the interactive
visualization in full-screen.
- 2021‑2023: nitrogen dioxide levels met the Canadian Ambient Air Quality Standards at 100 percent of assessed monitoring stations in B.C. There are two metrics for NO2—an annual standard and a 1-hour standard (see sidebar). The annual and 1‑hour standards were met at 100% of stations with sufficient data (47/47 and 46/46 stations, respectively).
- 2022‑2024: nitrogen dioxide levels met the Canadian Ambient Air Quality Standards at 100 percent of assessed monitoring stations in B.C. The annual and 1‑hour standards were met at 100% of stations with sufficient data (48/48 and 47/47 stations, respectively).
- During both periods, nitrogen dioxide levels met both of the Canadian Ambient Air Quality Standards in six of B.C.’s seven air zones. Currently, there are no air monitoring stations in the Northwest air zone.


