
Change in Size of B.C. Glaciers (1985-2005)
Glaciers get bigger and smaller—or advance and retreat—in response to changes in climate over time scales from decades to centuries. Glaciers thus respond to long-term changes in climate. This indicator measures changes in area of glacier ice coverage from 1985 to 2005 and changes in volume of glacier ice coverage from 1985 to 2000 in British Columbia. Results are provided for the seven terrestrial ecoprovinces in which glaciers occur in B.C.
- Glacier coverage in British Columbia retreated from 1985 to 2005. Area of ice coverage in the province as a whole decreased by 2525 km2 from 1985 to 2005. Volume of ice was lost at an average rate of 21.9 km3 per year in B.C. from 1985 to 2000.
- Glaciers in the Georgia Depression ecoprovince had the greatest proportional area loss at 34 percent. The glaciers in this region are small so this represents a small change in the overall ice coverage of the province (3 km2). The calculation of volume loss rate for these small glaciers has high uncertainty. The resulting volume change estimate is near zero for the period, however confidence in this number is low.
- The Coast and Mountains ecoprovince had the greatest ice coverage area loss of 1197 km2. Because most of the glaciers in B.C. are in the Coast and Mountains ecoprovince, this large area lost corresponds to a smaller percentage area loss than other regions of the province (-6.4%). The Coast and Mountains ecoprovince also experienced the greatest rate of ice volume loss with an estimated 15.4 km3 per year lost from 1985 to 2000 on average.
- Other ecoprovinces lost from 12 to 16 percent of area of ice coverage. The Northern Boreal Mountains have the second largest area of ice in the province and are currently experiencing the second largest rate of volume loss (-2.6 km3 per year).
- Climate models suggest that for most glaciers, changes in temperature control changes in glacier size. Although winter precipitation fuels the growth of a glacier, a warm summer can melt large gains from more than one previous year. The Intergovernmental Panel on Climate Change (IPCC) believes that warmer temperatures associated with climate change are the cause of world-wide glacial melting.
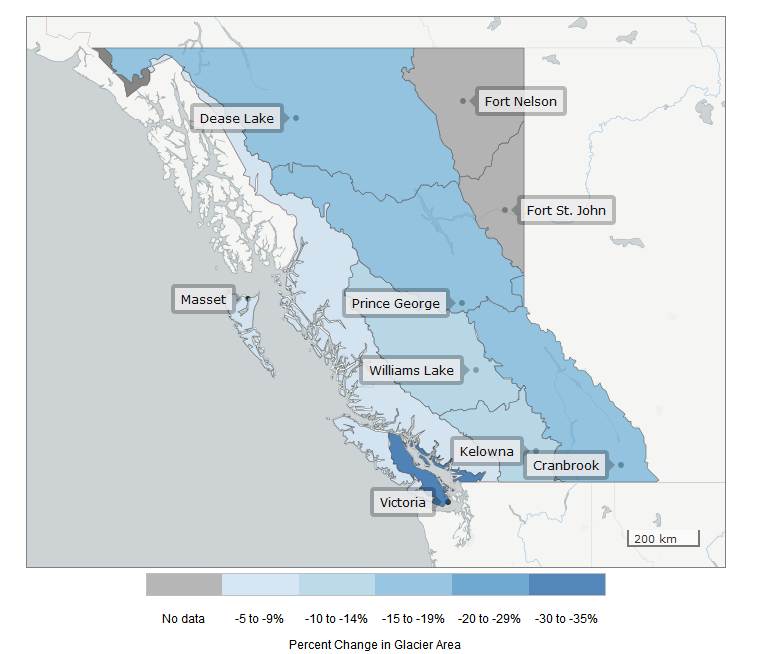
Tip: The interactive map below displays the change in glacier area from 1985 to 2005 (% and km2) and glacier volume loss rate from 1985 to 2000 (km3) for each of the seven terrestrial ecoprovinces in which glaciers occur in British Columbia. Hover or tap on any ecoprovince to see change in glacier area (% and km2) and glacier volume loss rate (km3) for that region.
Interpreting the Trend Information:
- This assessment was conducted by the Pacific Climate Impacts Consortium based on research conducted at the University of Northern British Columbia as part of the Western Canadian Cryospheric Network (WC2N).
- Change in size of glaciers was assessed by comparing and differencing the mapped and satellite-derived extents of glaciers. Glacier area data (1985 to 2005) was developed and provided by Bolch et al. (2010).1 Glacier volume change data (1985-2000) was developed and provided by Schiefer et al. (2007).2
- There are no glaciers in the Taiga Plains or Boreal Plains ecoprovinces of B.C. so no results are reported for those regions.
Comparison of Change in Ice Coverage Among Ecoprovinces (1985 - 2005)

More About Glacier Change
- Glacial meltwater feeds many mountain streams and rivers in B.C., including the Cheakamus River, Pemberton Creek, Slesse Creek, Homathko River, Lillooet River, and Squamish River. Glacier retreat is therefore likely to cause changes in the flow timing and temperature of some streams and rivers. These changes will likely have significant impacts on freshwater and estuarine ecosystems and on aquatic species. They will also affect other biological systems and human activities that depend on water.
- In the short term, melting glaciers will likely discharge more water into some B.C. streams and rivers as the water that has been stored as glacier ice over decades to centuries is released. In the longer term, glacier retreat will likely mean reduced water volume in glacier-fed streams and rivers, especially during the summer months.
- Both the Intergovernmental Panel on Climate Change (IPCC) and results from recent research forecast the continued widespread retreat of glaciers and ice caps through the 21st century.3
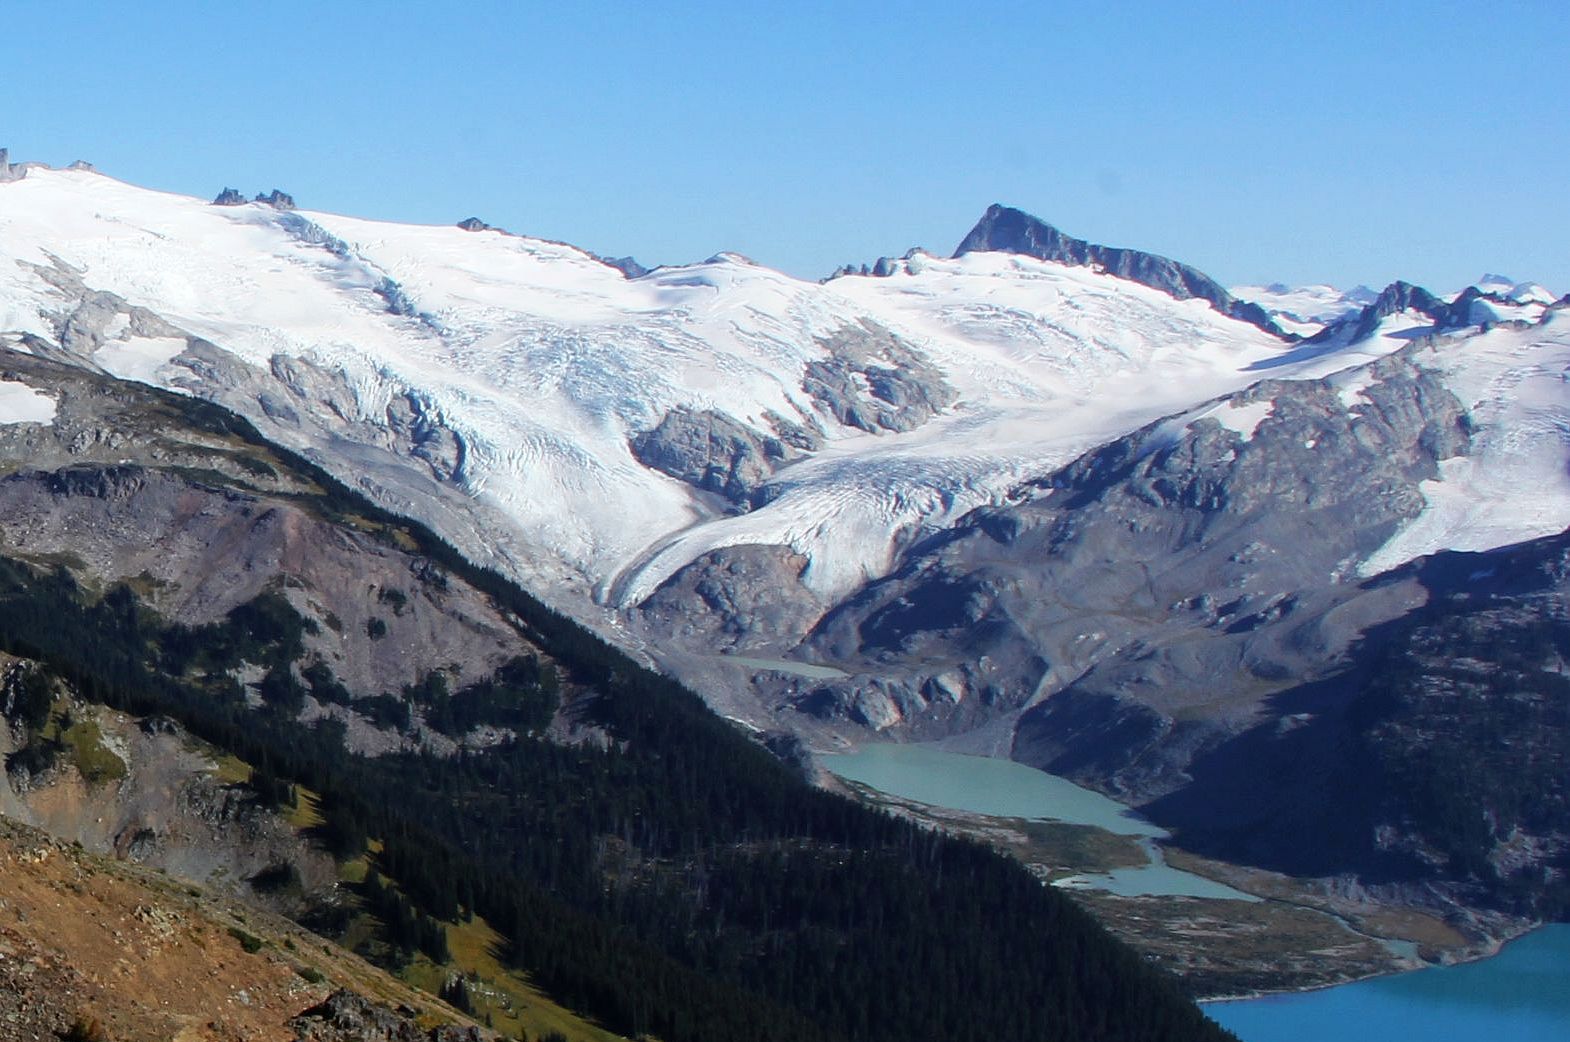
Sphinx Glacier in Garibaldi Provincial Park (Coast and Mountains Ecoprovince). Photo credit: Jane Wang
Methods
The methods used to develop this indicator and more about change in size of glaciers in B.C. and other climate indicators are available in Indicators of Climate Change for British Columbia (2015-16 Update) (PDF, 4.5MB). The R code for creating the graphs presented on this page is available on GitHub.
References and Other Useful Links
- Learn more about glaciers and climate change from the National Snow & Ice Data Center
- Learn more about climate science from the Pacific Institute for Climate Solutions online courses: Climate Insights 101
- B.C. Environment: Climate Change
- Pacific Climate Impacts Consortium
- Canadian Environmental Sustainability Indicators: Air and Climate Indicators
- 1Bolch, T., B. Menounos, and R. Wheate. 2010. Landsat-based inventory of glaciers in western Canada, 1985 – 2005. Remote Sensing of Environment 114: 127-137. (PDF, 1.4MB)
- 2 Schiefer, E., B. Menounos, and R. Wheate. 2007. Recent volume loss of British Columbia glaciers, Canada. Geophysical Research Letters 34(16): L16503. doi: 10.1029/2007GL030780
- 3Clarke, G.K.C., A.H. Jarosch, F.S. Anslow, V. Radic, and B. Menounos. 2015. Projected deglaciation of western Canada in the twenty-first century. Nature Geoscience 8(5): 372-377. doi: 10.1038/ngeo2407
Data
*By accessing these datasets, you agree to the licence associated with each file, as indicated in parentheses below.
Download Indicators of Climate Change for British Columbia (2015-16 Update) (PDF, 4.5MB)
Updated December 2015
Suggested Citation: British Columbia Ministry of Environment. (2015). Indicators of Climate Change for British Columbia: 2016 Update. Ministry of Environment, British Columbia, Canada.
