
Long-term Change in Heat Energy Available for Plant Growth in B.C. (1900-2013)
Plants and invertebrate animals require a certain amount of heat energy to grow. For example, spinach can grow when average daily temperatures are as low as 2.2°C, while corn requires daily temperatures of at least 10°C. The availability of heat energy is related to the average daily air temperature and is thus sensitive to changes in climate. This indicator measures changes in the amount of heat energy available for plant or animal growth from 1900 to 2013. Results are provided for British Columbia and each of the nine terrestrial ecoprovinces.
- Average available heat energy has increased in British Columbia from 1900 to 2013. On average there are 190 more Growing Degree Days (hereafter GDD) in British Columbia than at the beginning of the 20th century.
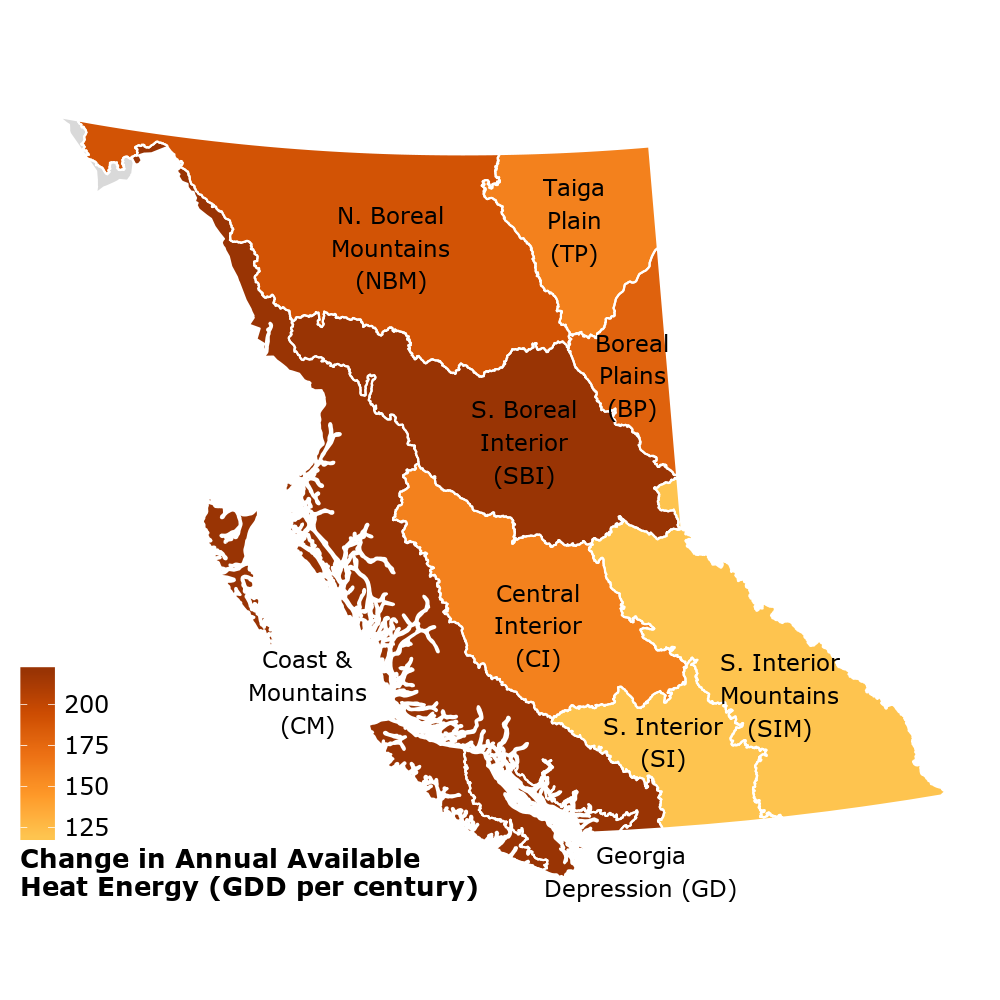
- The greatest increase in available heat energy is occurring in coastal British Columbia. The Coast and Mountains and Georgia Depression ecoprovinces are both experiencing an increase in energy available for plant growth of 220 GDD per century.
- Annual average heat energy is increasing by 160 to 190 GDD per century in northern parts of British Columbia. The Central Interior ecoprovince has an increase of 160 GDD per century. The annual trend in both the Southern Interior and Southern Interior Mountains ecoprovinces is an increase of 120 GDD per century.
- The availability of heat energy is related to the average daily air temperature. The temperate climate in coastal regions of B.C. means that increased temperatures, even in winter, will contribute to an increase in available heat energy for plant and invertebrate animal growth. In the northern part of the province however, where observed air temperatures have increased the most over the past century, winter temperatures generally remain below the 5°C threshold and so there is less increase in overall GDD.
Growing Degree Days?
Heat energy is measured in Growing Degree Days (GDD), the difference between the average daily temperature and 5°C, the average minimum temperature required for most agricultural plant growth.
GDD is zero on days where the average daily temperature is 5°C or lower. A 10°C day contributes 5 GDD; ten consecutive days of 10°C would contribute 50 GDD.
Observed Change in Annual Available Heat Energy (1900-2013)

Interpreting the Trend Information:
- This assessment was conducted by the Pacific Climate Impacts Consortium using data from Environment Canada and the BC Provincial Climate Data Set.
- Assessment of annual Growing Degree Days (GDD) is based on available air temperature records from 1900 to 2013. A threshold of 5°C, the average minimum temperature required for most agricultural plant growth, was used to calculate GDD. Annual GDD is calculated as the sum of daily GDD for the year.
- Results were found to be significant at the 95 percent level. This means that there is a less than 5 percent probability that the results arose randomly.
More About Available Heat Energy
- A significant increase in available heat energy could allow farmers to succeed in introducing new varieties of crops that were previously marginal or not viable in the region. If adequate soil moisture, soil fertility and light are also available, this could allow agriculture to expand to new regions and sites within the province.
- Some of the other impacts of climate change could have negative impacts on agriculture. Changes in hydrological systems combined with warmer temperatures and greater evapotranspiration, for example, may mean less available soil moisture in some regions. And warmer temperatures may also mean that new insect pest species are able to move into a region.
- Climate models indicate that temperatures will continue to rise in B.C. Available heat energy should continue to increase as the climate continues to warm.
Methods
The methods used to develop this indicator and more about change in available heat energy and other climate indicators are available in Indicators of Climate Change for British Columbia (2015-16 Update) (PDF, 4.5MB). The R code for creating the graphs presented on this page is available on GitHub.
References and Other Useful Links
- Learn about Long-term Change in Air Temperature in B.C.
- Learn more about climate science from the Pacific Institute for Climate Solutions online courses: Climate Insights 101
- B.C. Environment: Climate Change
- Pacific Climate Impacts Consortium
- Pacific Climate Impacts Consortium Data Portal
Data
*By accessing these datasets, you agree to the licence associated with each file, as indicated in parentheses below.
Download Indicators of Climate Change for British Columbia (2015-16 Update) (PDF, 4.5MB)
Updated December 2015
Suggested Citation: British Columbia Ministry of Environment. (2015). Indicators of Climate Change for British Columbia: 2016 Update. Ministry of Environment, British Columbia, Canada.
