
Long-term Change in Energy Requirements for Heating & Cooling Buildings in B.C.
Building managers, owners, and residents typically try to maintain buildings at a comfortable interior temperature of 18°C. As outdoor temperature goes down, the amount of energy required for heating goes up. Similarly, as outdoor temperature goes up, the energy demand for most air conditioner and refrigeration systems increases. This indicator measures changes in the average annual energy requirements for heating and cooling of similarly constructed and insulated buildings from 1900 to 2013. Results are provided for British Columbia and each of the nine terrestrial ecoprovinces.
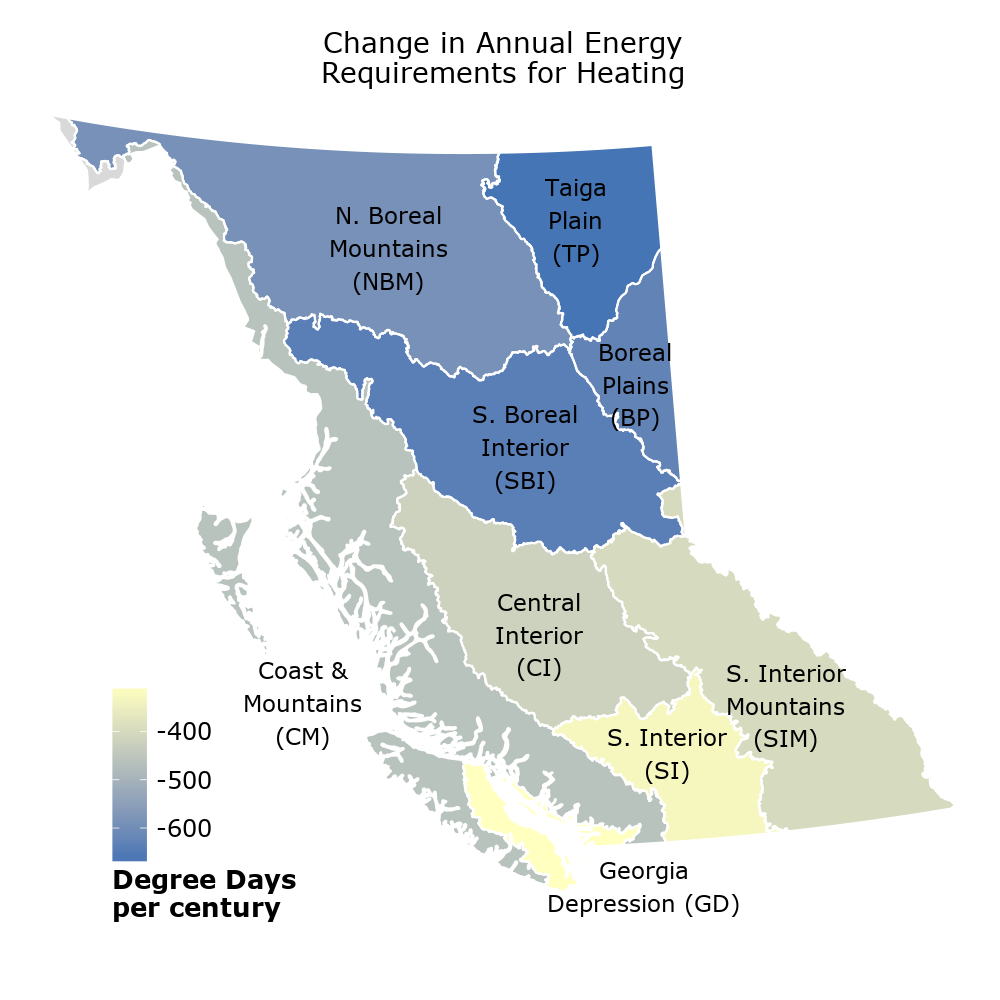
- Heating requirements decreased during the past century in British Columbia. Annual energy requirements for heating buildings in the province as a whole are decreasing by 600 Heating Degree Days (hereafter HDD) per century.
- The greatest reduction in heating requirements occur in the northern parts of B.C. In the Taiga Plains ecoprovince the anuual HDD has decreased by 670 HDD per century from 1900 to 2013. The Boreal Plains and Sub-Boreal Interior ecoprovinces experienced a decrease in HDD of 630 to 640 HDD per century.
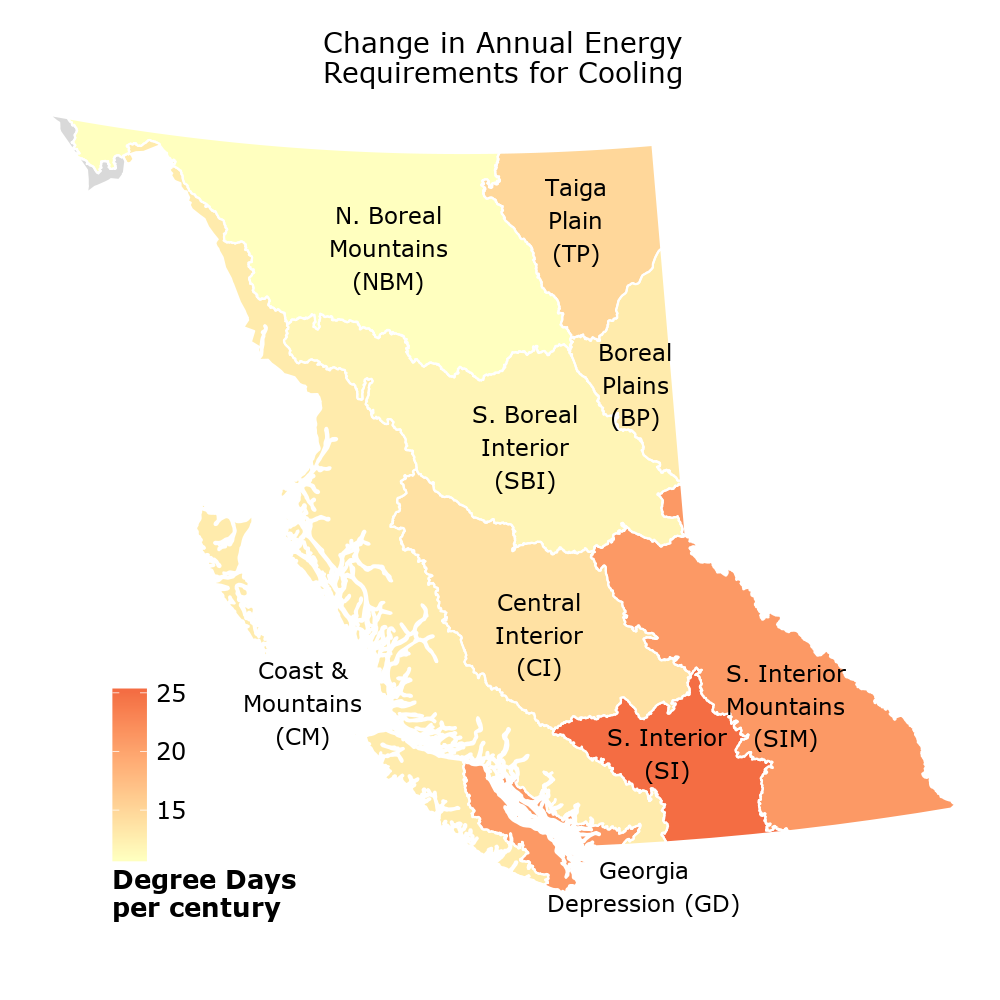
- Cooling requirements increased across B.C. during the past century Annual energy requirements for cooling buildings in the province as a whole are increasing by 13 Cooling Degree Days (hereafter CDD) per century.
- The greatest increase in cooling requirements has been in the southern part of B.C. The Southern Interior ecoprovince has experienced an increase in annual CDD at a rate of 25 CDD per century.
- Energy requirements for heating and cooling buildings are related to average daily air temperature. The observed changes in energy requirements are consistent with observed increases in average annual air temperatures across B.C. In winter, less energy is required to keep buildings warm when average daily temperatures increase, as they have throughout B.C. over the last century.
Heating & Cooling
Degree Days?
Energy requirements for heating and cooling buildings are measured in Heating Degree Days (HDD) and Cooling Degree Days (CDD), the difference between the average outdoor temperature and a comfortable interior temperature of 18°C.
A day with an average outdoor temperature of 10°C contributes 8 HDD while a 20°C day contributes 2 CDD.
Observed Change in Annual Energy Requirements for Heating and Cooling Buildings (1900-2013)

Interpreting the Trend Information:
- This assessment was conducted by the Pacific Climate Impacts Consortium using data from Environment Canada and the BC Provincial Climate Data Set.
- Assessment of energy requirements for heating and cooling buildings is based on available air temperature records from 1900 to 2013. A threshold of 18°C, what is considered a comfortable interior temperature, was used to calculate Heating Degree Days (HDD) and Cooling Degree Days (CDD). Annual values are calculated as the sum of daily HDD and CDD for the year.
- Results were found to be significant at the 95 percent level. This means that there is a less than 5 percent probability that the results arose randomly.
More About Energy Requirements for Heating and Cooling
- The energy supply industry uses annual HDD figures extensively to measure and project heating requirements. Annual HDD figures help the energy industry estimate demand for residential and other heating as well as maximum demand on energy supply systems during extremely cold periods. All else being equal, when annual HDD decreases, there is less demand for energy for heating.
- In most of British Columbia, cooling places minor demands on the energy system, and CDD is not a significant factor in energy management and planning decisions. However, CDD could be considered more for regional energy use planning in southern B.C.
- Climate models indicate that temperatures will continue to rise over B.C. during the 21st century and that atmospheric warming will be more pronounced in winter and summer than in spring and fall. Consequently, winter heating requirements will likely continue to decrease, and summer cooling requirements to increase.
Methods
The methods used to develop this indicator and more about energy requirements for heating and cooling and other climate indicators are available in Indicators of Climate Change for British Columbia (2015-16 Update) (PDF, 4.5MB). The R code for creating the graphs presented on this page is available on GitHub.
References and Other Useful Links
- Learn about Long-term Change in Air Temperature in B.C.
- Learn more about climate science from the Pacific Institute for Climate Solutions online courses: Climate Insights 101
- B.C. Environment: Climate Change
- Pacific Climate Impacts Consortium
- Pacific Climate Impacts Consortium Data Portal
Data
*By accessing these datasets, you agree to the licence associated with each file, as indicated in parentheses below.
Download Indicators of Climate Change for British Columbia (2015-16 Update) (PDF, 4.5MB)
Updated December 2015
Suggested Citation: British Columbia Ministry of Environment. (2015). Indicators of Climate Change for British Columbia: 2016 Update. Ministry of Environment, British Columbia, Canada.
