
Long-term Change in Precipitation in B.C. (1900-2013)
Precipitation is a fundamental aspect of climate and a key indicator of climate change. This indicator measures changes in average daily precipitation in percent per century at weather stations across British Columbia. Results are provided annually and for each of the four seasons for British Columbia and each of the nine terrestrial ecoprovinces.
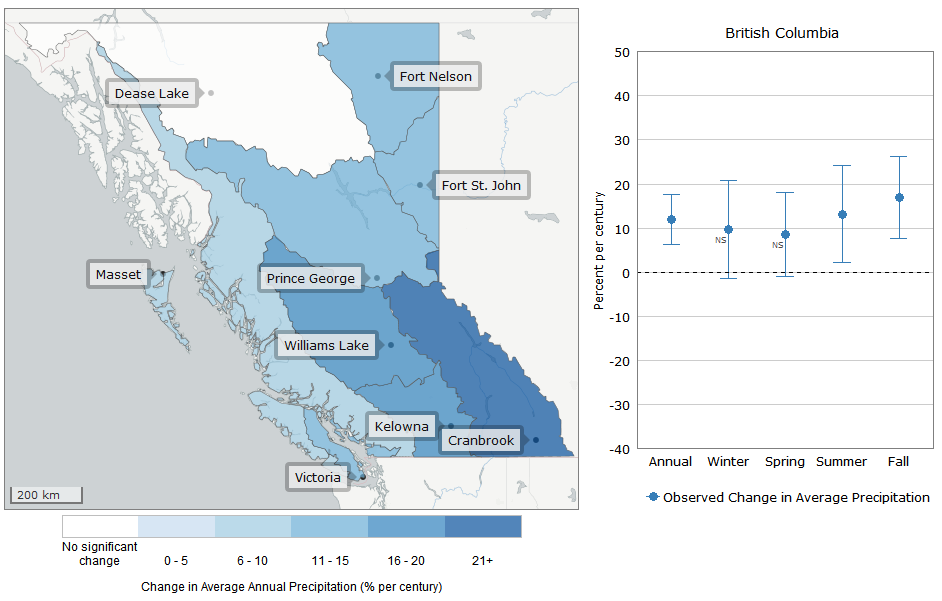
- Province-wide annual average precipitation has increased by 12 percent per century. Annual average precipitation increases ranged from 10 to 21 percent per century across 8 ecoprovinces.There is no significant trend in annual average precipitation for the Northern Boreal Mountains ecoprovince.
- Changes in seasonal precipitation are varied through B.C. For example, precipitation has increased by 23 percent per century in the spring in the Georgia Depression ecoprovince, however no other seasonal precipitation trends were detected for that region. In the Taiga Plains and the Northern Boreal Mountains ecoprovinces, the trends indicate an increase in precipitation in the winter, summer and fall, but not in the spring.
- There are few trends in winter precipitation across B.C. In addition, there are no seasonal trends in precipitation in the Coast and Mountains ecoprovince.
- Precipitation is highly variable across B.C. Long-term changes in the amount, form, and timing of precipitation will almost certainly have significant impacts on freshwater and terrestrial ecosystems. They will have both positive and negative impacts on human activities.
Natural and human systems are adapted to high variability in precipitation. Climate change, however, may mean a shift to warmer, wetter years, more frequent wet years, greater year-to-year variability, and more extreme precipitation events.
Observed Average Precipitation Change (1900-2013)
Tip: The interactive map and chart below displays the change in annual average precipitation in percent per century from 1900 to 2013 for British Columbia and each of the nine terrestrial ecoprovinces. Click on any ecoprovince—or tap twice on mobile devices—to see changes in annual and seasonal average precipitation for that region.
Interpreting the Trend Information:
- This assessment was conducted by the Pacific Climate Impacts Consortium using precipitation measurement data from Environment Canada and the BC Provincial Climate Data Set.
- Seasonal trends are based on averages for spring (March – May), summer (June – August), fall (September – November), and winter (December – February). The date that each season arrives varies across B.C. The seasonal trends described here are based on calendar dates and may therefore fail to reflect the experience of seasons on the ground for some parts of B.C.
- Results were found to be significant at the 95 percent level. This means that there is a less than 5 percent probability that the results arose randomly.
- Where the data fail to reveal a trend that is statistically significant at the 95 percent level, data are annotated with an "NS" to indicate that the trend is not significant.
- Trends are reported for the period 1900 to 2013; however, in the beginning of that time period the network of weather stations was relatively sparse through B.C. The statistical uncertainty in the trends may not fully capture the uncertainty that arises from changes in the observational network over time.
Methods
The methods used to develop this indicator and more about trends in precipitation and other climate indicators are available in Indicators of Climate Change for British Columbia (2015-16 Update) (PDF, 4.5MB). The R code for creating the graphs presented on this page is available on GitHub.
References and Other Useful Links
- Learn about Long-term Change in Air Temperature in B.C.
- Learn more about climate science from the Pacific Institute for Climate Solutions online courses: Climate Insights 101
- B.C. Environment: Climate Change
- Pacific Climate Impacts Consortium
- Pacific Climate Impacts Consortium Data Portal
- Canadian Environmental Sustainability Indicators: Air and Climate Indicators
Data
*By accessing these datasets, you agree to the licence associated with each file, as indicated in parentheses below.
Download Indicators of Climate Change for British Columbia (2015-16 Update) (PDF, 4.5MB)
Updated July 2015
Suggested Citation: British Columbia Ministry of Environment. (2015). Indicators of Climate Change for British Columbia: 2016 Update. Ministry of Environment, British Columbia, Canada.
