
Long-term Trends in Groundwater Levels in B.C.
Groundwater is an essential source of water for British Columbians. One in four people in B.C. rely on groundwater for drinking water. It also provides water for industry, municipalities, and farms.
Groundwater is found underground in layers of rock, gravel, or sand called aquifers. Human usage, weather, climate, and aquifer type all impact groundwater levels. B.C. has a network of > 200 observation wells to track groundwater availability in aquifers. These observations wells are not used for domestic or commercial purposes.
This indicator shows a trend analysis of groundwater levels in observation wells over time. The results are provided in an interactive map below and in a static version of the indicator linked at the bottom of the page. Summary figures of the trends observed across the province and regionally are provided after the interactive map.
- Wells that have been monitored for >10 years, have fewer than 15% missing observations, and were active as of 2013 are analyzed in this indicator.
- There are multiple options to look at trends in groundwater levels. You can select more recent trends (10 yrs, 20 yrs) or look at all the data available. You can also choose between annual average groundwater level trends or monthly trends. There are different data requirements for each trend option selected and the number of wells assessed varies.
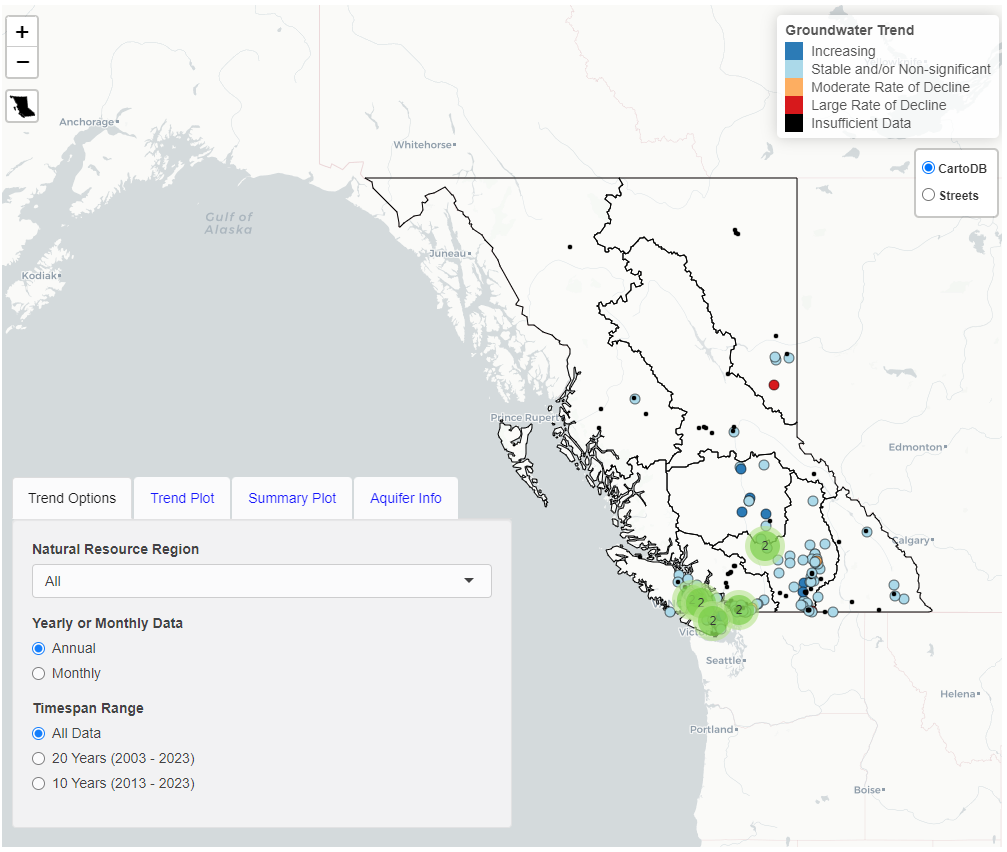
- The location of the wells and the trend results are provided in the interactive map below.
- The results are categorized by the statistical significance and magnitude of the change in groundwater levels over time. The categories are:
- Increasing: the trend was significantly different from zero with an increasing trend of 3 cm or greater per year.
- Stable and/or Non-significant: the trend was not significantly different from zero or the trend was significantly different from zero with a trend (increasing or decreasing) of less than 3 cm per year.
- Moderate Rate of Decline: the trend was significantly different from zero with a declining trend of between 3 and 10 cm per year.
- Large Rate of Decline: the trend was significantly different from zero with a declining trend of more than 10 cm per year.
- Insufficient Data: there is an observation well but there are not enough data to calculate.
It's Called Groundwater!
Trends in Groundwater Levels at Observation Wells
The map below is interactive and has several different trend options to explore. Here are some suggested steps for using the map below:
- Go to Trend Options tab in bottom left corner. There are several options here:
- You can navigate to a Natural Resource Region of interest by selecting it in the dropdown menu or by clicking it on the map.
- You can select annual or monthly trends. If you are interested in a particular month, select monthly and then select the month of interest in the dropdown menu.
- You can select the timespan you are looking for. For recent trends, you are able to select the last 20 years (2003-2023) or last 10 years (2013-2023). Please note that not all wells will have enough data for the 20 year trend timespan. Also, in many cases by selecting a shorter timespan, you are choosing to exclude part of the available dataset.
- Once the trend options are selected, you can click on an observation well of interest. Once the well is selected, the Trend Plot tab will be auto-selected. The results will be shown in the plot.
- Additional information about the groundwater levels over the timespan selected are provided in the Summary Plot tab.
- Additional information about the surrounding aquifer is available in the Aquifer Info tab. External links must be opened in a new browser tab.
- Click or use the dropdown menu to select a natural resource region or observation well on the map below to explore trends in groundwater levels. Select "All" to return to all regions.
- Click on a tab to see different information about each observation well. Note: external links need to opened in a new browser tab.
- Click on the B.C. button in the top left corner to return to the view of the province.
Provincial Summary of Trends in Groundwater Levels by Aquifer (10 year trends)
- There were 140 observation wells that met the data requirements for assessment of 10 year trends. The 140 observation wells assessed were located in 113 aquifers. The results of 10 year trend analysis for observation wells were grouped by aquifer. The results are grouped by aquifer as some aquifers have multiple wells with the same trending results which may skew the provincial and regional findings.
- The 10 year results are used to compare observation wells across aquifers as each well has a different time span of data.
- The "Mixed" category introduced below occurs when an aquifer has multiple observation wells with different trending categories (i.e. an aquifer has one well with "Stable and/or Non-significant" results and one with "Increasing" results).
- Of the 113 aquifers, 77% of results were stable and/or non‑significant trends. Increasing trends were detected in 9% of aquifers. 4% of aquifers show a moderate rate of decline in water levels, and 4% of aquifers show a large rate of decline. Note that only wells with enough data for trend analysis are included in the following figures.

Regional Summary of Trends in Groundwater Levels (10 year trends)
- The number of wells in each Natural Resource Region across B.C. varies. The highest number of aquifers assessed were in the West Coast Region. There were no observation wells in the Skeena and Omineca regions with enough data to assess 10-year trends.

More About Groundwater Levels
- Groundwater levels are sensitive to precipitation, aquifer storage capacity, recharge rate—the rate at which surface water trickles down to refill a groundwater aquifer—and human withdrawal.
- Groundwater level trends presented here indicate long-term changes in water levels, but have not been corrected for changes in precipitation patterns or other factors. Thus, any significant trends are not necessarily directly attributable to any single factor.
- Information on long-term trends can be useful for prompting further research and informing decision-making.
Methods
Note on trend significance
- In the interactive map above, there are instances where a decreasing or
increasing trend is visually observed in the plot but the change over time was not found to be statistically significant. When a trend is
not statistically significant, it means the observed pattern was not clear enough to rule out the trend occurring by
random chance (i.e. the null hypothesis of no trend is accepted). We used a p‑value of 0.05 which translates to
a <5% chance the observed trend happened by random chance. When a trend is not significant, you should be
cautious about interpreting the presence and magnitude of a visual trend. High variability in data points, sample
size, magnitude of the trend, and other factors impact the p‑value. When using trend results to make decisions,
p‑values are one of several important considerations.
Important changes in trend analysis methods
- The methods used in the trend analysis are different from previous versions of this indicator and the results cannot be directly compared.
The full methods used to develop this indicator and further statistical results are available in the printable version of this indicator (PDF).
R package and code: We have developed an R package to facilitate working with, analyzing, and visualizing British Columbia groundwater level data. Download the 'bcgroundwater' package from GitHub. The source code for repeating the analysis presented on this page is also available on GitHub.
References and Other Useful Links
- Visit the Monitoring Aquifers: Provincial Observation Well Network homepage for more information on groundwater monitoring observation wells.
- Groundwater Wells and Aquifers (GWELLS)
- Water Data and Tools for British Columbia
- Previous B.C. State of Environment reports and indicators on groundwater levels in B.C.
- 1Gurdak, J.J., R.T. Hanson, and T.R. Green. 2009. Effects of Climate Variability and Change on Groundwater Resources of the United States. United States Geological Survey. Fact Sheet 2009–3074. (PDF)
Data
*By accessing these datasets, you agree to the licence associated with each file, as indicated in parentheses below.
- Indicator Summary Data: Long-term Trends in B.C. Groundwater Levels
- Provincial Groundwater Observation Well Network - Groundwater Levels Data
- Groundwater well metadata, such as location, depth, and aquifer type were obtained from the Ground Water Wells (Spatial View) Dataset
- Natural Resource (NR) Regions
Download a printable version of this indicator (PDF).
Updated October 2024
Suggested Citation: Environmental Reporting BC. 2024. Long-term Trends in Groundwater Levels in B.C. State of Environment Reporting, Ministry of Environment and Climate Change Strategy, British Columbia, Canada.
