 |
|||||
|
Fish & Wildlife Main Page > Lake Stock Assessment Reports > Berman Lake Recreational Fishery Stock Assessment 1999 Final Report
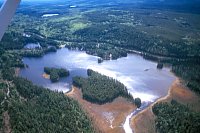
PHOTO 1. Berman Lake Introduction
This report presents the results of a stock assessment of Berman Lake, completed on July 22, 1999 under a partnership arrangement between the Ministry of Environment, Lands and Parks and the Carrier Sekani Tribal Council (CSTC), with funding obtained from Fisheries Renewal B.C. through the Upper Fraser-Nechako Fisheries Council. Margo French and Lawrence Ward of the CSTC delivered the fieldwork component of the assessment; the author conducted the analysis and reporting of the field results. Inquiries pertaining to this report should be directed to the author at the email and address located at the bottom of this page. The earliest survey record on file (pre-1970 note to file, no date), reports that Berman Lake contained rainbow trout and suckers, however the method by which this result was obtained is not specified. A more comprehensive biophysical survey was conducted in 1970, although no fish were directly sampled at this time. The lake was subsequently stocked with rainbow trout in 1976 and received intermittent releases until 1986, when the lake was placed on an annual schedule of 5000 yearlings per year. In September 1989, a stock assessment was performed to evaluate the status of the stocked fishery, however this effort was not successful in obtaining a large enough sample to provide management recommendations for the Berman Lake trout population. No further surveys had been performed on Berman Lake, and it was therefore assigned a high priority assessment for 1999.
Methods A 91.4 m sinking monofilament gill net with experimental mesh sizes was set in Berman Lake on July 21, 1999, according to the methods specified in the Resource Inventory Committee document Fish Collection Methods and Standards. The net was deployed in an E-W orientation near the Berman Lake Forest Recreation Site at 10:12 AM, and retrieved the same day at 12:00 PM. The net was reset at a second location, near the alternate Forest Recreation Site, in a WNW orientation (Figure 1) at 12:30 PM, and was retrieved July 22 at 10:30 AM. The total combined soak time for both net sets was 23.75 hours. All trout collected were sampled for fork length, weight, sex,
stomach contents, and maturity. Weight was measured to the nearest
25 g. Scales were collected for age structure analysis. This analysis
was performed by Darlene
Gillespie of TimeMark Consulting Ltd. (Nanaimo, B.C.).
Results and Discussion
CATCH SUMMARY The net catch yielded 12 rainbow trout (RB), 8 peamouth chub, 14 longnose suckers, and 25 whitefish, for a catch per unit effort (CPUE) of 0.5 RB per net-hour. See Appendix 1 for specific fish attribute data. The sex ratio of the sample was 8 females : 2 males, while 2 were classified as "unknown". Two fish were classified as "immature", the remaining 10 were "mature". These results are similar to those reported in 1989, wherein 4 rainbow trout, 50 mountain whitefish, and 11 longnose suckers were captured, for a RB CPUE of 0.67 RB per net-hour. CONDITION
The weight of the sampled population increased according to the equation W = 3 x 10-11 x W 5.15, where W = weight in grams and L = length in millimeters. The rate of increase in weight (as a function of length) is substantially greater for this population than for that observed from trout in similar lakes in the region. This observation may be attributable to the small sample size, to a rapid improvement in feeding success with growth, or to measurement error. While the mean condition factor of the population was quite low (Table 2) at 0.72, the improvement in condition factor relative to length suggests that larger fish are more robust and healthier than the younger cohorts. AGE and GROWTH
The sampled population was dominated by 4-year-old trout (Figure 3), suggesting that the 3-year-old cohort was too small on average to recruit to the sampling gear. No trout younger than 3 years old were captured, and of the 3 3-year-old fish sampled, 2 were less than 250 mm (Figure 4). One 338 mm fish was classified as a 3-year-old, however this age is likely in error since the remainder of the population did not exhibit this high growth rate. The slow growth rate of Berman Lake trout may be ascribed to both inter- and intra-specific competition. Previous surveys noted the presence of wild trout, whose yearlings could have a competitive advantage over hatchery-raised fry. In addition, competition with cyprinids for limited food resources could impede growth and may explain the poor condition noted for younger size classes. At current growth rates, rainbow trout must attain an age of 4 years before recruiting into the recreational fishery, assuming a mimimum target size of 250 mm by recreational anglers.
Management Recommendations The interpretation of the results from this assessment are confounded by the fact that Berman Lake at one time supported a wild population of rainbow trout. Using the methods employed in this survey, it is impossible to discriminate between hatchery and wild or naturalized stock. This limits the scope of management recommendations that can be made at this time. At a minimum, it is evident that the stock sampled during this assessment exhibits slow growth, and that these trout must grow for at least 4 years, prior to being available to the recreational fishery. Berman Lake may therefore provide few catchable trout to the angler, since natural mortality will have diminished the catchable population during the 4 year growth period. This is supported by the low CPUE recorded for the gill net sample. Additional investigation is needed to better understand the relative proportion of wild and hatchery stocks in Berman Lake. It is recommended that a systematic approach to discriminating the stocks be developed, perhaps by applying a fin clip to one or two hatchery cohorts, or through the application of scale pattern analysis to differentiate wild from hatchery origin fish. Until additional data can be obtained, it is recommended that the the lake receive large trout (i.e. >20 g) of the Blackwater strain. This should minimize predation risk while boosting initial growth rates, so that they are better able to compete for limited food resources. At present there is no data available on angler use or satisfaction at Berman Lake. Whether the lake is overlooked by anglers due to its proximity to Norman Lake needs to be assessed, and the total exploitation of the lake on a seasonal basis should be measured.
Literature Cited. Bustard and Janssen 1970. Berman Lake Lake Survey Data.
Note to File. Fisheries Branch, Ministry of Environment. Prince
George.
For More Information: Contact :Ted Zimmerman
|
||||||||||||||||||||||||||||||||||||||||||||||||||||||||||||