
Long-term Change in Timing & Volume of River Flow in B.C.
Changes in the timing and volume of river flow can affect both natural ecosystems and human communities—they can affect our ability to predict and manage seasonal water resources and flood risks, and may impact natural systems that rely on natural flow patterns. Low river flows in summer may reduce the amount of water available for agriculture, hydroelectric power generation, industry and communities. Low river flows are also associated with declines in water quality and warmer water temperatures which can threaten the health of aquatic ecosystems. This indicator measures changes in timing and volume of river flow at six monitoring stations over an 80 to 100 year period up to 2012. Trends in river flow were also examined at five additional stations across B.C. over a 55 year period (1958-2012).
- Long-term change in timing of river flow has occurred at several locations in B.C. Change in river flow timing is measured as the trend in the date by which one-half of the total annual volume of each river has passed. Long-term analysis shows that the date when fifty percent of the annual water volume has passed became 9 days earlier at the Stellako station and 6 days earlier at the Fraser River at Hope station. The Adams station half-flow date became 7 days later over the past century.
- Long-term changes in the volume of river flow have occurred at some locations in B.C. River flow change is measured as the trend in the minimum, maximum and mean daily water flow, either annually or seasonally. While mean annual river flows did not change significantly over the long term, annual minimum flows increased at three of the six stations analyzed over this time period. Long-term summer river flows decreased at some locations—Lillooet and Stellako demonstrated decreases in mean summer flows as well as late summer minimum flows, where declines of 31% and 39% were observed.
- Changes in flow volume were also observed at several stations over the medium-term period of 1958-2012. Late Spring maximum flows decreased at the Koksilah and Columbia, and late summer minimum flows decreased at three stations (Chemainus, Stellako, and Fraser). Mean summer flow also decreased at four stations (Stellako, Clearwater, Fraser, and Columbia).
- Many factors affect trends in timing and volume of river flow. Changes in temperature, precipitation, and evapotranspiration can all affect the timing and volume of river flow. Trends also depend on the location, size, elevation, and whether the river basin is predominately rainfall- or snowmelt-fed—and whether substantial glacial cover exists. Thus, trends in river timing and flows are not uniform across B.C.
Observed Changes in Volume of River Flow
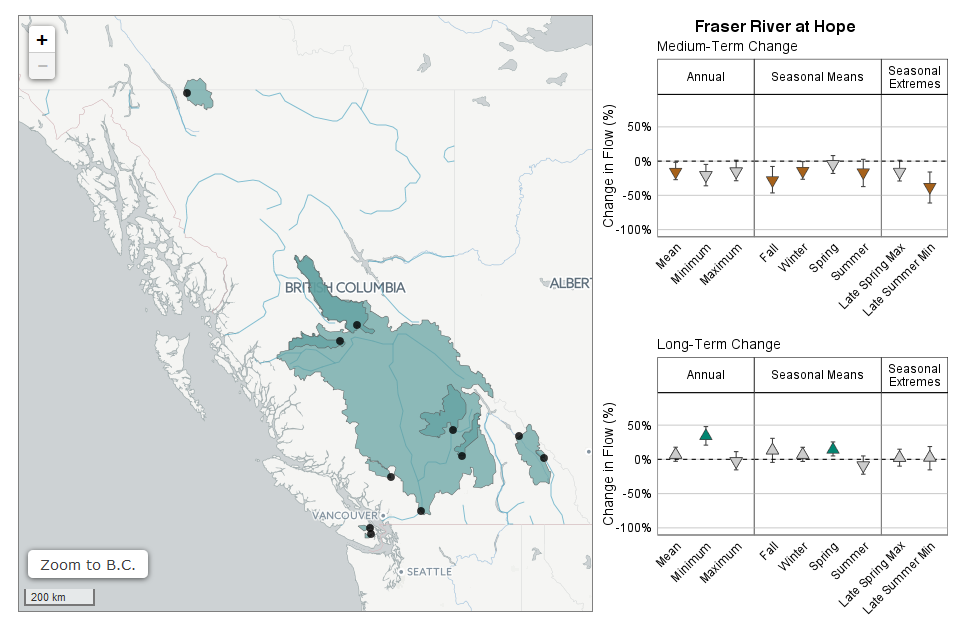
Explore the interactive map below to see long-term (80-100 year) and medium-term (55 year) changes in volume of river flow. Each flow monitoring station—shown as a black dot—represents the flow within a watershed, which are displayed on the map as blue polygons. Note that the very large Fraser River watershed also contains several smaller watersheds. Click on the map to view observed changes in river flow timing and volume at each station. Change estimates coloured grey indicate that the trend is not statistically significant.
 Your screen is too small to display the interactive map. Click to see the interactive visualization in full-screen.
Interpreting the Trend Information:
- This assessment was conducted by the Pacific Climate Impacts Consortium using data from the Environment and Climate Change Canada HYDAT Database.
- Ten of the eleven stations were selected based on record length, representation of major hydrologic regimes in B.C. and their association with the Reference Hydrometric Basin Network, where direct human influence and land use change have not significantly altered the river flow regime over time. The Fraser River at Hope station was analyzed because it is a significant watershed in the province—the station time series was adjusted to account for flows lost to water extractions starting in 1958.
- Note that different methods were used to assess the statistical significance of a trend, and the magnitude (and 95% confidence interval) of the trend. This can lead to occasional discrepancies between the statistical significance and whether or not the trend estimate confidence interval includes zero.
- Results were found to be significant at the 95 percent level. This means that there is a less than 5 percent probability that the results arose randomly.
Methods
The methods used to develop this indicator, and more about change in timing and volume of river flow and other climate indicators are available in Indicators of Climate Change for British Columbia (2015-16 Update) (PDF, 4.5MB). The R code for creating the graphs presented on this page is available on GitHub.
References and Other Useful Links
- Learn about other indicators of climate change for B.C.
- Learn more about climate science from the Pacific Institute for Climate Solutions online courses: Climate Insights 101
- B.C. Environment: Climate Change
- Pacific Climate Impacts Consortium
- Pacific Climate Impacts Consortium Data Portal
Data
*By accessing these datasets, you agree to the licence associated with each file, as indicated in parentheses below.
Download Indicators of Climate Change for British Columbia (2015-16 Update) (PDF, 4.5MB)
Updated August 2017
Suggested Citation: British Columbia Ministry of Environment. (2016). Indicators of Climate Change for British Columbia: 2016 Update. Ministry of Environment, British Columbia, Canada.
