
Long-term Change in Air Temperature in B.C. (1900-2013)
Air temperature is one of the main properties of climate and the most easily measured, directly observable, and geographically consistent indicator of climate change. This indicator measures changes in minimum, average, and maximum temperature in degrees Celcius (°C) per century. Results are provided annually and for each of the four seasons for British Columbia and each of the nine terrestrial ecoprovinces.
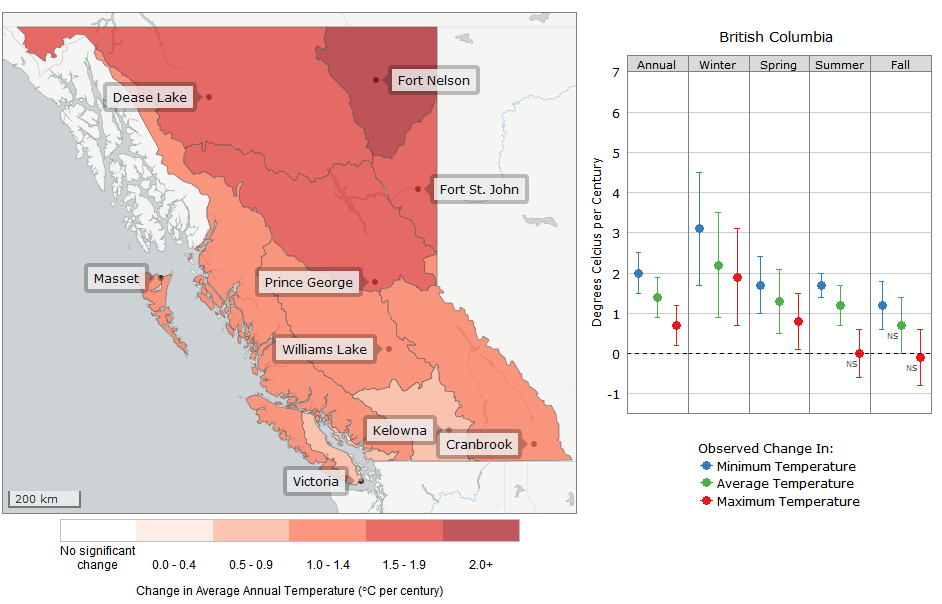
- British Columbia has warmed an average of 1.4°C per century from 1900 to 2013. This is higher than the global average rate of 0.85°C per century. The northern regions of B.C. have warmed 1.6 to 2.0°C per century, twice the global average. Southern coastal regions have warmed 0.8°C per century, roughly equivalent to the global average rate.
- Most of the annual warming trend has occurred in the winter. The average temperature increase in winter across the province is 2.2°C per century. Winter temperatures have increased by 3.0 to 3.8°C per century in the north, 2.6 to 2.9°C per century in the north-central region and 1.5 to 1.7°C per century in central, interior and southeastern B.C.
- Annual maximum temperatures increased by an average of 0.7°C per century. Seasonal data indicate that maximum winter temperatures increased across most of B.C. Maximum spring temperatures are increasing in the north, but data do not reveal a trend in the southern half of B.C. No trends were detected for maximum temperature in the summer and fall.
- Annual minimum temperatures increased across B.C. an average of 2.0°C per century from 1900 to 2013. The greatest increase in minimum temperature has been in the Boreal Plains ecoprovince, where daily minimum temperature increased at a rate equivalent to 2.8°C per century.
- Seasonal data indicate that minimum temperatures increased across all of B.C. for all seasons. The average minimum temperature increased 3.1°C per century in winter for the province. In the Boreal Plains the minimum temperature increased at the greatest rate for all ecoprovinces, in all seasons.
Trends in Air Temperature
Average temperature increased over all of B.C. from 1900 to 2013.
Winter is warmer on average than it was 100 years ago.
Minimum temperatures are warmer on average than they were a century ago.
The increase in minimum temperature is particularly noticeable in the winter season and the northern regions of B.C.
The strong, increasing trends in minimum temperature, especially during the winter, have likely made the greatest contribution to the general warming trends across B.C. The impacts of warmer temperatures will vary across the province and seasons. Higher temperatures drive other changes in climate systems and affect physical and biological systems which can have both positive and negative impacts on human activities.
Observed Average Temperature Change (1900-2013)
Tip: The interactive map and chart below displays the change in annual average temperature in degrees Celcius (°C) per century from 1900 to 2013 for British Columbia and each of the nine terrestrial ecoprovinces. Click on any ecoprovince—or tap twice on mobile devices—to see changes in annual and seasonal minimum, average, and maximum temperature for that region.
Interpreting the Trend Information:
- This assessment was conducted by the Pacific Climate Impacts Consortium using temperature measurement data from Environment Canada and the BC Provincial Climate Data Set.
- Seasonal trends are based on averages for spring (March – May), summer (June – August), fall (September – November), and winter (December – February).
- Results were found to be significant at the 95 percent level. This means that there is a less than 5 percent probability that the results arose randomly.
- Where the data fail to reveal a trend that is statistically significant at the 95 percent level, data are annotated with an "NS" to indicate that the trend is not significant.
More About Temperature Change
- Natural variability in air temperature in B.C. is strongly affected by El Niño and other natural changes in air and ocean currents, which cause year-to-year and decade-to-decade variability in weather and climate across the province.
- The warming trends observed in B.C. during the 20th and 21st century are above and beyond natural variability and almost certainly reflect long-term climate change.
- The Intergovernmental Panel on Climate Change (IPCC) has concluded that most of the observed global atmospheric warming of the last 50 years is due to increases in atmospheric greenhouse gas concentrations and consequent feedback. Greenhouse gas emissions resulting from a variety of human activities, including the burning of fossil fuels and the clearing of land for agriculture and urban development, are responsible for this increase.
- Average annual temperature across B.C. will continue to vary from year to year in response to natural cycles in air and ocean currents. However, what are now considered to be relatively warm years will almost certainly increase in frequency.
- More information about expected future climate patterns in B.C. is available at Plan2Adapt.
Methods
The methods used to develop this indicator and more about trends in air temperature and other climate indicators are available in Indicators of Climate Change for British Columbia (2015-16 Update) (PDF, 4.5MB). The R code for creating the graphs presented on this page is available on GitHub.
References and Other Useful Links
- Learn about Long-term Change in Air Temperature in B.C.
- Learn about Long-term Change in Precipitation in B.C.
- Learn more about climate science from the Pacific Institute for Climate Solutions online courses: Climate Insights 101
- B.C. Environment: Climate Change
- Pacific Climate Impacts Consortium
- Pacific Climate Impacts Consortium Data Portal
- Canadian Environmental Sustainability Indicators: Air and Climate Indicators
Data
*By accessing these datasets, you agree to the licence associated with each file, as indicated in parentheses below.
Download Indicators of Climate Change for British Columbia (2015-16 Update) (PDF, 4.5MB)
Updated July 2015
Suggested Citation: British Columbia Ministry of Environment. (2015). Indicators of Climate Change for British Columbia: 2016 Update. Ministry of Environment, British Columbia, Canada.
