|
(published
1998)
Habitat Atlas for Wildlife at Risk
Species Profiles
The atlas profiles thirty-two Red- and
Blue-listed species and their habitats in the South
Okanagan and Lower Similkameen valleys. Recent advances
in computer generated mapping, such as Geographic Information
Systems, have made it possible to model habitat use
patterns of wildlife species. Detailed ecosystem maps
are combined with data on an animal's breeding, nesting,
feeding, migration and hibernation requirements to produce
Habitat Suitability Maps.
 Habitat
suitability is the ability of the habitat in its current
condition to provide for the habitat requirements of
a species. Wildlife habitat suitability models were
developed for 30 regionally important wildlife species
using Terrestrial Ecosystem Mapping (TEM). Habitat
suitability is the ability of the habitat in its current
condition to provide for the habitat requirements of
a species. Wildlife habitat suitability models were
developed for 30 regionally important wildlife species
using Terrestrial Ecosystem Mapping (TEM).
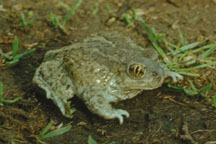
Amphibians
& Reptiles |
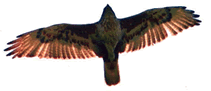
Birds |
Mammals |
|
|
|
(Several Red
and Blue-listed
species that occur in the area are not included in the
atlas. They are either species that only rarely occur
here in migration, no longer occur in the Okanagan region,
or so little is known about their habitat requirements
that conservation measures are difficult to prescribe.)
Map Information
Breeding habitat, or the most important
habitat is listed first. If breeding and foraging habitat
overlap, breeding habitat is shown first.
Living habitat includes breeding and
foraging in one category in cases where there is no
difference in the habitat requirements.
Wildlife habitat models profile habitat that
is able to support a particular species. However, the
species may not actually occur there at present. The
habitat maps identify where species are likely to occur
and which areas are the most important to conduct inventories,
environmental impact assessments, and habitat enhancement
projects.
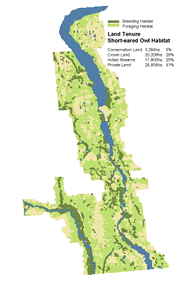
Each map has a land tenure chart showing land ownership
of habitat.
In this example, 6% of Spadefoot Toad habitat is protected
in conservation holdings (parks or wildlife areas),
26% occurs on Provincial Crown land, 29% on Indian Reserves,
and 39% on privately owned land.
Land Tenure
Great Basin Spadefoot
Conservation Land - 3,489 ha. - 6%
Crown Land - 14,951 ha. - 26%
Indian Reserve - 16,689 ha. - 29%
Private Land - 22,977 ha. - 39% |
 |
Methods
 Wildlife
habitat suitability has been modeled by interpreting
the ecosystem features included in Terrestrial Ecosystem
Mapping (soil, ground cover plants, trees or shrubs,
terrain) in terms of the probable use of those features
by an animal. Critical life requirements of a species
can include habitat needs for breeding or nesting, escape,
security cover, and feeding activities. By defining
the relationships between ecosystems and a species'
requirements, habitat attributes are identified that
are important to the species. The key habitat attributes
are assigned habitat use values which are then related
to the map units to develop the species habitat profile.
The localities that are ranked the highest, identify
the highest quality habitat for a particular life requirement
(such as nesting habitat). However, the high quality
habitats alone will likely not sustain the wildlife
population or species through time, therefore lower
quality habitat is also identified. Wildlife
habitat suitability has been modeled by interpreting
the ecosystem features included in Terrestrial Ecosystem
Mapping (soil, ground cover plants, trees or shrubs,
terrain) in terms of the probable use of those features
by an animal. Critical life requirements of a species
can include habitat needs for breeding or nesting, escape,
security cover, and feeding activities. By defining
the relationships between ecosystems and a species'
requirements, habitat attributes are identified that
are important to the species. The key habitat attributes
are assigned habitat use values which are then related
to the map units to develop the species habitat profile.
The localities that are ranked the highest, identify
the highest quality habitat for a particular life requirement
(such as nesting habitat). However, the high quality
habitats alone will likely not sustain the wildlife
population or species through time, therefore lower
quality habitat is also identified.
 The
maps produced for the Habitat Atlas have identified high
and moderate quality habitat for each species. High quality
habitat implies that the habitat is within 75 to 100 percent
of the best habitat for the species in the province. Moderate
quality habitat indicates that the habitat is within 25
to 75 percent of the best habitat in the province. Moderate
quality habitat is important to many species since the
amount of high quality habitat remaining is limited in
the two valleys. The
maps produced for the Habitat Atlas have identified high
and moderate quality habitat for each species. High quality
habitat implies that the habitat is within 75 to 100 percent
of the best habitat for the species in the province. Moderate
quality habitat indicates that the habitat is within 25
to 75 percent of the best habitat in the province. Moderate
quality habitat is important to many species since the
amount of high quality habitat remaining is limited in
the two valleys.
Limitations of the Maps
Terrestrial Ecosystem Mapping has been mapped at a
1:20,000 scale. Many habitat attributes, such as small
patches of isolated vegetation, cannot be identified
at this scale of mapping.
Riparian habitats, which are narrow strips of vegetation
located along the edges of streams, ponds or lakes,
cannot be mapped at a 1:20,000 scale. Therefore species
that rely on this ecosystem cannot be mapped accurately
with the TEM. Other more sedentary species also rely
for survival on micro-scale habitat attributes not identified
in TEM, such as pockets of particular soil types.
The habitat maps are not an indication of the
presence of a species. As an example, Short-eared Owl
habitat extends over 44 percent of the South Okanagan
and Lower Similkameen area, but this species rarely
breeds in the South Okanagan and is only occasionally
sighted. Breeding habitat is a more accurate representation
of critical habitat areas for many species.
Due to the limitations
of web site graphics, the quality and size of the habitat
maps for each species is poor. Please refer to the Habitat
Atlas for Wildlife at Risk publication for higher resolution
maps. (See Contact Information)
|